The file that finally has the denominator — and the denominator prices nothing
Published 2026-08-11 · records retrieved 2026-08-11 · our band fixed as of 2026-08 · how we build these numbers
Compare against our furnace replacement guide →
Four records on this site have died of the same cause: a public file with a dollar amount in it and nothing to divide the dollar amount by. San Francisco's re-roof permits state no roof size on 94% of filings. Cincinnati's water service replacements carry a contracted amount and not one linear foot. Louisiana's audit publishes a median re-roof cost and never asks how big the roof was. Pittsburgh's painting bids are per square foot of a square foot the solicitation never defines.
So a federal program that records the home — floor area, year built, storeys, heating fuel, blower-door readings before and after — alongside the invoice it paid looks like the answer to all four. Delaware publishes exactly that. It is the richest unit-level cost file we have opened, and it still cannot check a band, for a reason none of the permit records prepared us for.
1. What this record is
The Weatherization Assistance Program is a U.S. Department of Energy program, delivered by states, that pays contractors to weatherize the homes of low-income households. Delaware's Department of Natural Resources and Environmental Control publishes its jobs one row at a time as bggt-57c5 on data.delaware.gov, dedicated to the Public Domain. Rows were last updated 2023-12-04; we retrieved the file on 2026-08-11.
Thirty-eight columns. Among them, and this is the part that made us open it: unit_size in square feet, unit_year_built, unit_stories, housing_unit_type, primary_heating_fuel, pre_wx_test_cfm and post_wx_test_cfm, a furnace_replacement flag, and total_invoice_cost.
# population
curl -s 'https://data.delaware.gov/resource/bggt-57c5.json?$select=count(1)'
# => [{"count_1":"1893"}]

# the analysis columns. city and zip are not selected, and neither are the
# auditor, contractor and inspector name fields: this file is about
# individual low-income households and we publish nothing at row level.
curl -s -G 'https://data.delaware.gov/resource/bggt-57c5.csv' \
  --data-urlencode '$select=client_reference,program_year,invoice_date,housing_unit_type,primary_heating_fuel,unit_size,unit_year_built,furnace_replacement,total_invoice_cost' \
  --data-urlencode '$limit=50000' > de_wap.csv
# 1,894 lines including the header
2. What it measures — and what it quietly does not
The invoice total is the best-evidenced money column in this ledger. It is not a valuation declared at application like a permit, and it is not a bracket a homeowner picked off a survey like the Louisiana audit's. A contractor billed it, a state subgrantee paid it, and the file names the auditor who specified the work and the inspector who signed it off. Of 1,893 rows, 1,873 carry a positive invoice and 1,855 carry a floor area.
What it does not measure is what the money bought. There is no measure-level cost anywhere in the file. The invoice total is accompanied by eight columns splitting it across funding sources — WAP base, RGGI, utility, LIHEAP, each in a purchase-order and a health-and-safety flavour — and by not one column splitting it across the work. Air sealing, attic insulation, duct repair, a new furnace and a carbon monoxide alarm arrive as one number.
The dates matter too. Invoices run 2014-10-07 to 2023-11-07 across program years 2014 to 2023, so the newest row is 33 months older than the 2026-08 stamp on our HVAC data. And the file's own year-by-year medians are not flat — $5,198 in 2014, $5,000 in 2016, $6,285 in 2019, $8,438 in 2021, $8,992 in 2022 — so pooling a decade is itself a decision.
One more thing this file is not: a market. WAP work is placed through a small number of state subgrantee agencies with contracted crews. Two organizations deliver the entire file — Catholic Charities on 1,328 rows and the Energy Coordinating Agency, under three labels, on 565 — and a single weatherization contractor appears on 726 of the 1,893 rows. Whatever those invoices are, they are not what a household would be quoted on the open market.
3. The denominator, tested
Before asking the furnace question, test the premise that brought us here. If the home's square footage is the denominator four earlier records went looking for, it should price something:
# ordinary least squares, invoice on floor area
# restricted to 300-6,000 sq ft, which drops exactly two rows:
# one recorded at 152 sq ft and one at 1 sq ft
n = 1,846
invoice = 5,383 + 0.47 x sqft        r-squared = 0.006
Forty-seven cents a square foot, and the size of the house explains 0.6% of the variance in what was spent on it. The middle half of these homes runs 960 to 1,680 square feet; across that entire range the fitted size effect is about $340, against invoices whose middle half spans $3,781 to $7,166. The denominator is present, correct, and inert.
That is not a defect in Delaware's record-keeping. It is what weatherization is. The bill is set by which measures the energy audit specified for that particular house — whether the attic was already insulated, whether the ducts leaked, whether a cracked heat exchanger forced a replacement — and none of that is a function of floor area. The sewer record found the same shape in a different trade: two cities that write the run length into the permit, and length explaining 5% and 32% of the price.
4. The cohort, and the one furnace figure the file can be made to yield
There is one lever. The file carries a furnace_replacement flag: N on 1,714 rows, Y on 99, blank on 80. Take the difference of medians between the two groups and you have something that looks like the cost of adding a furnace to a weatherization job:
| Delaware WAP jobs, 2014–2023 | p25 / median / p75 | n |
|---|---|---|
| Furnace replacement = Y | $5,349 / $7,980 / $12,000 | 98 |
| Furnace replacement = N | $3,781 / $5,481 / $7,166 | 1,701 |
| Difference of medians | $2,499 | — |
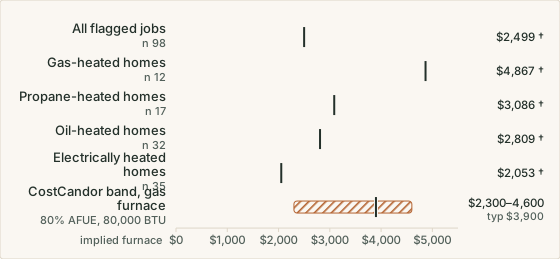
$2,499 lands inside the band our furnace guide publishes for an 80% AFUE gas furnace, which is $2,300 to $4,600 installed with a typical of $3,900 — that band is a Goodman list price of $1,285 / $1,733 / $1,768 times the disclosed 1.2 / 1.4 / 1.6 markup, plus furnace-only labor of $800 / $1,500 / $1,800, all read from hvac-system.json at its 2026-08 stamp.
Now cut the same 98 jobs a different way. The flag says a furnace was replaced; it does not say what kind, and this is Delaware, where the housing stock burns four fuels in roughly equal measure:
| Same flag, split by the fuel the house burns | Y median | N median | Difference |
|---|---|---|---|
| Gas — 12 jobs | $9,769 | $4,902 | $4,867 |
| Propane — 17 jobs | $9,117 | $6,031 | $3,086 |
| Oil — 32 jobs | $8,657 | $5,848 | $2,809 |
| Electric — 35 jobs | $7,080 | $5,027 | $2,053 |
Four fuels, four answers, a 2.4x spread, and the largest of them belongs to the twelve gas-heated jobs that happen to match our band's fuel. Split by housing type instead and it comes apart again: $1,663 across 47 mobile homes, $4,175 across 40 detached houses, $5,776 across seven attached ones — a 3.5x spread on the same flag.
Only 12 of the 99 flagged jobs are gas-heated at all. Thirty-five are electric, where "furnace replacement" means an air handler or an electric furnace; 49 are oil or propane; the remaining three are blank or list two fuels. Our band prices a gas furnace. The flag is not measuring it.
5. Verdict
Verdict
(C) Comparison rejected — the only furnace figure this file can produce is one we would have had to derive, and it comes out four different ways.
The $2,499 sits inside our published band, and we are printing that because leaving it out would be the dishonest choice. We are not banking it, for the same reason the Louisiana audit's $12,981 was not banked: a figure produced by arithmetic nobody performed on an invoice is not a price. There the state derived it and hid the model; here we would be deriving it in public, which is better journalism and exactly as weak as evidence.
The instability is the proof. Difference of medians on the whole cohort gives $2,499; on the gas-heated subset $4,867; on mobile homes $1,663; on attached houses $5,776. One flag, one file, one afternoon, and a range that spans from below our low to above our typical. Any of those numbers could be reported as a confirmation and each would be a different confirmation. The subgroup would be chosen after seeing the answer, which is not a test but a preference.
Two further problems would survive even a stable estimate. The invoice covers whatever the auditor specified for that house, and nothing in the file says how much of it was the furnace. And WAP prices are placed through state subgrantees and their contracted crews — one contractor is on 726 of 1,893 rows — so they are not what the open market charges, which is the thing our band claims to describe.
Our band therefore stands where it stood, at the 2026-08 stamp on hvac-system.json, which was set on 2026-08-11 by the Kansas City and Seattle permit records and not by anything on this page.
6. What this file is actually good for
Not prices — but it answers a question homeowners ask constantly and cost guides answer badly, which is whether the size of your house predicts what a job will cost. On the best unit-level evidence we have found, for this kind of work, it does not. Forty-seven cents a square foot and six-tenths of one percent of the variance.
Three things to carry from that into a real quote:
- Distrust any price quoted per square foot of floor area for work that is not measured in floor area. Insulation is priced by the area actually covered, duct sealing by the run, a furnace by the machine. A whole-house number divided by your square footage is a marketing unit, not a rate.
- Make the scope, not the house, the thing you compare. The reason two weatherization invoices differ by a factor of three is that the audits specified different work. Ask for the measure list and the price against each line, which is what the state requires before it pays.
- If heating equipment is bundled into a larger job, get it priced separately anyway. This entire record exists because Delaware bundled it and nobody can unbundle it afterwards. Our furnace replacement guide and the HVAC system calculator price the equipment line on its own so you have something to hold a bundled bid against.
Frequently asked questions
Does a bigger house cost more to weatherize?
Barely, on the only unit-level evidence we have found. Across 1,846 Delaware Weatherization Assistance Program jobs with both a floor area and a paid invoice, least squares gives an invoice of $5,383 plus 47 cents per square foot, and the home's size explains 0.6% of the variance. The middle half of those homes runs 960 to 1,680 square feet, so the entire size effect across that range is about $340 on invoices whose middle half spans $3,781 to $7,166. What drives the bill is which measures the auditor specified, and that is the one thing the file does not record.
How much does a furnace replacement add to a weatherization job?
The file will give you an answer and you should not use it. Jobs flagged as including a furnace replacement have a median invoice of $7,980 against $5,481 for jobs without one, a difference of $2,499. Split the same 98 jobs by the fuel the house burns and the difference becomes $4,867 for gas, $3,086 for propane, $2,809 for oil and $2,053 for electric; split them by housing type and it becomes $1,663 for mobile homes and $5,776 for attached houses. One flag, seven answers, spanning 3.5x from end to end. None of them is a furnace price.
Is program cost data better than permit data for checking prices?
It is better paperwork and usually a worse denominator. These are invoices a contractor submitted, a state agency paid and an inspector signed off, so unlike a permit valuation nobody guessed at the number. But the invoice covers whatever the energy auditor specified for that house — air sealing, insulation, duct work, health and safety items, sometimes heating equipment — and the file records the total in one column with eight funding-source splits beside it and no measure-level cost anywhere. A permit at least names the work.
Why not just use the gas-heated subset?
Twelve jobs. Across the whole file only 12 furnace-replacement rows are in gas-heated homes, and their invoices run from $2,670 to $18,548 with a median of $9,769 — whole-job totals, not furnace prices. Choosing that subgroup because it matches our band's fuel, after seeing that it gives the largest difference of the four, would be fitting the cohort to the result. That is the error this ledger exists to prevent.
Sources
Outside record: State of Delaware, Grants for Weatherization Services, data.delaware.gov resource bggt-57c5, attributed to the Department of Natural Resources and Environmental Control, Division of Climate, Coastal & Energy, dedicated to the Public Domain; rows last updated 2023-12-04, retrieved 2026-08-11 (1,893 rows, invoices dated 2014-10-07 to 2023-11-07). Our band: data/hvac-system.json at its 2026-08 stamp (furnaceListUSD.standard and furnaceOnlyLabor) with the contractor equipment markup from data/ac-replacement.json. Figures on this page are planning ranges, not quotes.