A file that states the efficiency — and takes one of our bands with it
Published 2026-08-11 · records retrieved 2026-08-11 · our band fixed as of 2026-08 · how we build these numbers
Run your own numbers in the HVAC system calculator →
The Seattle furnace record published beside this one has 5,887 filings and one hole in it: the city almost never writes down which furnace was installed, and our band has three rungs that differ by exactly that. So it could show that the ladder is too short without saying which rung to move, and it could not rule out the answer that Seattle is simply expensive.
Kansas City's permit file is a sixteenth the size and answers both questions. It carries a permit type named Install/Replace Furnace, and the scope text beside it routinely reads “INSTALL 80% 75K FURN” or “HVAC Replacement: 3 Ton, 16 SEER, 96%, 80,000 BTU”. Efficiency on 71% of the filings, BTU input on 97%, tonnage wherever cooling is involved. Nothing about the Midwest is expensive. The result splits cleanly in two, and only one half of it is bad news.
1. What this record is
The dataset is the City of Kansas City, Missouri permit file, resource ntw8-aacc, published by its Department of City Planning and structured to the open Building & Land Development Specification. It carries estprojectcost as a numeric column, permittype, permitclass and a free-text description. We retrieved it on 2026-08-11.
Two things about this source have to be said before any number is quoted. It is not live. Its Socrata row timestamp reads 2025-05-09T20:22:28Z and the newest issue date under our permit type is 2025-05-06; the portal's own metadata still claims a nightly refresh. And it declares no license. The metadata carries no licenseId at all — not a public-domain dedication, not a named license. So we read the portal's Terms of Use, which disclaim warranty, reserve the City's intellectual-property rights, add an indemnity obligation, and require derivative applications to carry a disclaimer. Nothing there restricts derived statistics. We reproduce no rows, and print the required disclaimer verbatim:
“This site provides applications using data that has been modified for use from its original source, www.data.kcmo.gov, the official open data website of the City of Kansas City. The City of Kansas City makes no claims as to the content, accuracy, timeliness, or completeness of any of the data provided at this site. The data provided at this site is subject to change at any time. It is understood that the data provided at this site is being used at one’s own risk.”
Two queries reproduce the cohort. The date bound is set below the file's own last row, so the counts are stable whether or not the portal ever wakes up:
# population: residential furnace permits with a declared cost
curl -s -G 'https://data.kcmo.org/resource/ntw8-aacc.json' \
  --data-urlencode "\$where=permittype='Install/Replace Furnace' \
                    AND permitclass='Residential' \
                    AND issueddate >= '2022-01-01' \
                    AND issueddate < '2025-05-10' \
                    AND estprojectcost > 0" \
  --data-urlencode '$select=count(1)'

# => [{"count_1":"1356"}]
# the fields the analysis needs. Address, contractor name and coordinates
# are deliberately not selected: this site publishes derived statistics and
# the queries behind them, never rows identifying a household.
curl -s -G 'https://data.kcmo.org/resource/ntw8-aacc.csv' \
--data-urlencode '$select=permitnum,issueddate,estprojectcost,description' \
--data-urlencode "\$where=permittype='Install/Replace Furnace' \
AND permitclass='Residential' \
AND issueddate >= '2022-01-01' \
AND issueddate < '2025-05-10' \
AND estprojectcost > 0" \
--data-urlencode '$limit=50000' > kc_furnace.csv2. What it measures — and what it quietly does not
The rate-table test first, the one that ended our Los Angeles re-roof record. Across the 362 furnace-only filings there are 198 distinct amounts and the ten commonest hold 34.3% — the loosest concentration of any money column we have opened, and about as far from a fee schedule as a self-reported field gets. The declared amounts are treated as prices.
What makes this file worth a stale download is the second column that is effectively inside the first. The description carries an AFUE rating on 257 of 362 furnace-only filings (71.0%) and a BTU input on 352 of 362 (97.2%). Our furnace band is published as three efficiency tiers at a fixed 80,000 BTU size, so for the first time a record can be laid against it rung by rung rather than against the ladder.
Now what it does not measure. The file stopped moving in May 2025, fourteen months before our band's stamp. Our own data carries the BLS producer price index for air-conditioning and warm-air heating equipment at +3.2% over the year to May 2026, so these prices are, if anything, low relative to what our band is meant to describe. We do not adjust for it, and note that leaving it alone is the choice that flatters us.
Three more limits, all shared with every permit record we publish. The declared amount is filed at application, not invoiced at completion. Only permitted work is visible, which biases the cohort toward professional jobs. And a description is a sentence rather than a scope: “Install 96%, 60k BTU furnace.” may have carried venting or gas-line work nobody typed. The exclusion list removes named bundles, not unnamed ones.
One limit specific to the split below. Filings are sorted into furnace-only and furnace-plus-cooling by whether the text names cooling equipment. A furnace-only job whose author simply did not mention the air conditioner would land on the wrong side and drag the furnace-only median up. That error runs against our band, so we state it rather than assume it away.
3. The cohort, and what we dropped
The permit type holds 3,962 filings, every one of them classed Residential, issued between 2018-08-08 and 2025-05-06, with a positive declared cost on 3,960 of them. Restricting to filings issued from 2022-01-01 leaves 1,356. Then the description sorts them:
# local narrowing, applied to kc_furnace.csv
cool  = r'(?i)\ba/?c\b|air\s*cond|condenser|\bseer\b|\btons?\b|\d\s*t\b|cooling|'
        r'heat\s*pump|\bhp\b|mini[\s-]*split|ductless|coil|air\s*handler|\bahu\b'
noise = r'(?i)water\s*heater|boiler|new\s*(?:s/?f|single\s*family|home)|'
        r'new\s*construction|fireplace|dryer|hood|pool|generator|commercial|'
        r'apartment|duplex'
diy   = r'(?i)homeowner\s*to\s*do|owner\s*to\s*do|affidavit'
eff   = r'(?i)\b(8[0-9]|9[0-9])\s*%'          # 257 of 362 furnace-only filings
btu   = r'(?i)(\d{2,3})\s*,?\s*000|(\d{2,3})\s*k\b'   # 352 of 362
ton   = r'(?i)(\d+(?:\.\d+)?)\s*[-\s]?\s*(?:ton|tons)\b'

# furnace-only    = says 'furn', no cool, no noise, no diy   => n 362
# furnace+cooling = says 'furn', has cool, no noise, no diy  => n 683
That leaves 362 furnace-only filings and 683 furnace-plus-cooling filings. Dropped: 198 that never say furnace at all, 60 furnace-plus-cooling and 34 furnace-only filings that also name duct work, 13 bundled into something that is not a house change-out, and 6 carrying a homeowner-to-do-the-work affidavit. That last group is small and its median is $2,500, which is what a job with no billed labor in it looks like; keeping it would have helped us.
What survives reads like this, with no address or amount attached: “INSTALL 80% 75K FURN”, “Furnace is 96% 2 stage ECM 60,000 BTU”, “Replace 70K BTU Furnace and 2 Ton Air Conditioner.”
4. The two distributions and our two bands on the same axis
Our bands are arithmetic, and both are printed here in full so the comparison can be re-run. The furnace-only band is a furnace list price times the disclosed 1.2 / 1.4 / 1.6 contractor markup, plus furnace-only labor of $800 / $1,150 / $1,500. The full change-out band is the same markup applied to furnace plus condenser plus coil, plus one crew day of $1,600 / $2,500 / $3,600:
furnace only, 80,000 BTU class          low  /  typical  /  high
  80% AFUE      1285/1733/1768 x mk  =  2,342 /  3,576 /  4,329
  96% AFUE      1600/1883/2100 x mk  =  2,720 /  3,786 /  4,860
  97% modulating 2600/3000/3400 x mk =  3,920 /  5,350 /  6,940

full change-out, 3 tons + 80,000 BTU furnace, ducts reused
  standard  (80% + SEER2 14.3)        =  6,953 /  9,793 / 12,470
  mid       (96% + SEER2 15.2)        =  8,704 / 11,604 / 14,832
  high      (97% + SEER2 16-17)       = 10,986 / 14,431 / 18,355

# mk = markup 1.2 / 1.4 / 1.6 applied component-wise; condenser list at
# 3 tons is 2,276 / 3,420 / 4,322 by tier and the matched coil is
# 900 / 1,200 / 1,500. The guide rounds the furnace-only tiers to
# $2,300-$4,300, $2,700-$4,900 and $3,900-$6,900.| Kansas City, 2022-01 to 2025-05 | p25 / median / p75 | Our band for that job |
|---|---|---|
| Furnace only, all filings (n = 362) | $4,044 / $5,300 / $6,522 | — |
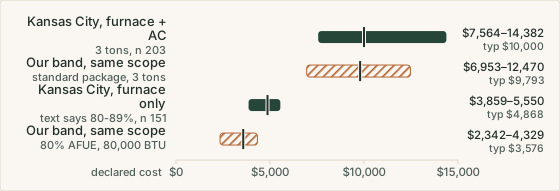
| Furnace only, text says 80–89% (n = 151) | $3,859 / $4,868 / $5,550 | $2,342 / $3,576 / $4,329 |
| Furnace only, text says 90–96% (n = 95) | $5,000 / $6,064 / $7,000 | $2,720 / $3,786 / $4,860 |
| Furnace only, text says 97%+ (n = 11) | $6,000 / $7,000 / $8,000 | $3,920 / $5,350 / $6,940 |
| Furnace only, 80,000 BTU class (n = 178) | $4,000 / $5,000 / $6,300 | Tier not held constant |
| Furnace only, by year | 2022 $4,800 · 2023 $5,566 · 2024 $6,000 · 2025 $5,900 | n = 145 / 55 / 99 / 63 |
| Furnace + AC, 3 tons (n = 203) | $7,564 / $10,000 / $14,382 | $6,953 / $9,793 / $12,470 |
| Furnace + AC, all filings (n = 683) | $8,000 / $10,000 / $13,800 | Tonnage not held constant |
| Furnace + AC by tonnage — medians | 2t $8,944 · 2.5t $10,000 · 3.5t $11,000 · 4t $11,676 · 5t $14,262 | n = 70 / 110 / 55 / 80 / 23 |
| Filings at or above each furnace-only high | 80% 258 (71.3%) · 96% 231 (63.8%) · 97% 81 (22.4%) | $4,329 / $4,860 / $6,940 |
Two rows carry the whole record, and they point opposite ways.
The full change-out row is the closest agreement this site has recorded. At 3 tons with an 80,000 BTU furnace — the size our calculator prices for a 1,700 to 2,100 square foot home — our standard-package typical of $9,793 sits 2.1% below a median of $10,000 on 203 filings. Our three package typicals, $9,793, $11,604 and $14,431, span that median to the 75th percentile, which is what a three-tier band is supposed to do against a market that buys all three tiers. And the observed medians climb with tonnage without reversing, from $8,944 at 2 tons to $14,262 at 5, which is the shape a real price has.
The furnace-only rows do not survive their own tiers. Where the filing says 80-something percent, the median is $4,868 against a published ceiling of $4,329. Where it says 90 to 96, the median is $6,064 against $4,860. Where it says 97 or above — eleven filings, printed as shape — the median is $7,000 against $6,940. Every rung of the ladder is beaten by the middle of its own matched cohort, in a market whose full change-out we price to within 2.1%.
That last clause is what makes the finding structural rather than regional. Kansas City is not an expensive market, and the record proves it inside itself: the same file, the same declared-cost column, the same year, agrees with our combined band and disagrees with our furnace-only band. The arithmetic in between is the ratio. Their furnace-only median is 53% of their furnace-plus-AC median, $5,300 against $10,000. Ours is 37%, $3,576 against $9,793. We priced half the machine as half the visit, and a change-out crew does not work that way.
5. Verdict
Verdict
(B) Band moved — the furnace-only band is corrected, and the full change-out band standing next to it is left exactly as it was.
Two findings from one file, and the second is what licenses the first. The full change-out band was checked against 203 same-size filings and landed 2.1% from their median, so this record has no general quarrel with our HVAC arithmetic, our markup, or this city's price level. Against that background the furnace-only result is hard to explain away: three efficiency tiers, three matched cohorts, three medians above three ceilings, in a market where the combined job prices correctly.
What the record cannot do is set the replacement values, because it cannot split the gap. Part of it is the labor line — 8 to 12 crew-hours for a furnace against 16 to 24 for a change-out, when the observed ratio is 53% rather than 37%. Part of it is not labor at all: our equipment anchor is a Goodman list price, and Seattle's filings, where they name a brand, say Trane 240 times and Goodman 11. Closing the whole gap in the labor line would require a furnace-only labor typical above the full change-out labor typical, which is incoherent. So the correction below moves furnace-only labor to the ceiling of the man-hour and billed-rate envelope our own file already declares, and stops there. That is a first correction, not a final figure, and it deliberately leaves the 80% and 96% medians outside our band.
Printed above is the band as it stood at the check: our HVAC pricing data is stamped 2026-07, this record was retrieved 2026-08-11. Nothing here is edited afterwards; the change to the data is dated below as its own entry.
6. If you are getting furnace quotes anywhere
Kansas City's permit clerks are, accidentally, modelling the quote you should be asking for. Make the bid state the four things their scope text states: the efficiency rating, the BTU input, the tonnage if cooling is included, and whether the existing ducts are being reused. Those four lines make two quotes comparable and they are exactly what our calculator needs to price the job. Then ask the question this record answers: whether pricing the furnace and the air conditioner together changes the number. The combined job shares one mobilization and one crew day, and both this file and our own bands agree that the combined price is far less than two separate visits — if the second machine is close to the end of its life anyway, that is a real saving rather than an upsell. If it is not, say no. A bid at the low end with no efficiency rating written on it is not a cheap bid, it is an unfinished one. Our HVAC system calculator prices the combined scope line by line, the furnace guide covers the furnace alone, and the AC replacement calculator handles the cooling side on its own.
Frequently asked questions
How much does a furnace replacement cost in Kansas City?
On permits filed under the city's own Install/Replace Furnace type, describing a furnace and no cooling equipment, the median declared cost is $5,300 across 362 filings issued between January 2022 and May 2025. Split by the efficiency written into the same sentence: 80–89% AFUE runs a median of $4,868 across 151 filings, 90–96% runs $6,064 across 95, and the eleven filings naming 97% or above run $7,000. At the 80,000 BTU size specifically the median is $5,000. The file stopped being refreshed in May 2025, so these are 2022–2025 prices, not 2026 ones.
Which of our bands survived this check and which did not?
The full change-out band survived. For a 3-ton system with an 80,000 BTU furnace our calculator publishes $6,953 / $9,793 / $12,470 on the standard efficiency package, and the 203 Kansas City filings that pair a furnace with a 3-ton air conditioner run $7,564 at the 25th percentile, $10,000 at the median and $14,382 at the 75th. Our typical is 2.1% below their median, and our three package tiers — $9,793, $11,604 and $14,431 — span their median to their 75th percentile. The furnace-only band did not survive: at 80% AFUE we publish $2,300–$4,300 and their median for that tier is $4,868, and the same is true one rung up and one rung further up.
If the whole job is priced right, how can half of it be priced wrong?
Because the two bands are not built from the same arithmetic. The change-out band charges one crew day of labor for the whole visit — 16 to 24 crew-hours, $1,600 to $3,600 — while the furnace-only band charges 8 to 12 hours, as though half the machine meant half the visit. Kansas City's own filings say it does not: their furnace-only median is 53% of their furnace-plus-AC median, where our bands put it at 37%. Some of the remainder is not labor at all. Our equipment anchor is a Goodman list price, the cheapest major brand, and the market these permits describe is buying Lennox, Trane and Carrier. We can see that the residual exists and we cannot split it, so the correction moves the line we can defend and says so.
Why use a dataset that stopped updating in May 2025?
Because nothing else we found states the efficiency. Twenty-odd permit portals publish a dollar amount; this one publishes a permit type named Install/Replace Furnace and a description that carries the AFUE rating on 71% of filings and the BTU input on 97%. That denominator is the thing four of our earlier records went looking for and did not find, and it is worth accepting a stale file to get. The staleness is disclosed rather than corrected: the file's last row is dated 2025-05-06 against a band stamped 2026-07, and the equipment producer price index in our own data rose 3.2% over the year to May 2026. Adjusting for it would widen the gap, so we leave it and let the older prices flatter us.