Seattle has 5,887 furnace swaps on file — and our band sits under nearly all of them
Published 2026-08-11 · records retrieved 2026-08-11 · our band fixed as of 2026-08 · how we build these numbers
Run your own numbers in the HVAC system calculator →
Our three HVAC calculators had never been held up against a public record. The reason was the same one that ended four roofing checks: permit files publish a dollar amount and withhold whatever you would have to divide it by. A furnace is different, because the job is the appliance. If a filing says a furnace was replaced and says nothing else, the declared amount is the price of replacing a furnace, and no denominator is needed.
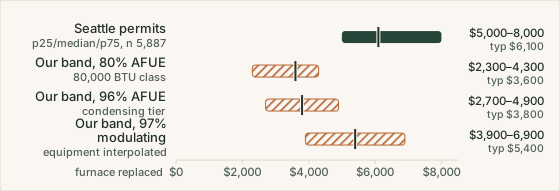
Seattle keeps a whole permit type for it. This record opens that file, isolates the filings that describe only a furnace, and puts them next to the band our furnace guide publishes. The band loses. What the file cannot do is say which of its three tiers loses, and that limit is most of what follows.
1. What this record is
The dataset is the Seattle Department of Construction & Inspections trade permit file, resource c87v-5hwh on the city's open-data portal. Its Socrata metadata carries licenseId: "PUBLIC_DOMAIN", attribution City of Seattle, and a declared refresh frequency of Daily. The row timestamp read 2026-08-11T00:06:22Z when we pulled on 2026-08-11, and the newest issue date inside the file was 2026-08-07.
Three fields do the work. permittype carries a value named Single-Family/Duplex Furnace — the city sorts this job into its own bin, which is the whole reason this record exists. description is free scope text. And estprojectcost is defined in the column metadata as “the estimated project cost of the work being proposed is based on fair market value (parts plus labor)”, “the best available information to date”, and “subject to change if the project is modified”. It is the same field and the same agency our panel upgrade record used, on a different resource.
Two queries reproduce the cohort. Both carry an upper date bound, so the window cannot grow with the calendar, though a file rewritten daily can still gain a late filing inside it:
# population: single-family furnace permits, Jan 2023 through Jul 2026
curl -s -G 'https://data.seattle.gov/resource/c87v-5hwh.json' \
  --data-urlencode "\$where=permittype='Single-Family/Duplex Furnace' \
                    AND permitclass='Single Family/Duplex' \
                    AND issueddate >= '2023-01-01' \
                    AND issueddate < '2026-08-01'" \
  --data-urlencode '$select=count(1)'

# => [{"count_1":"26963"}]
# the four fields the analysis needs. Address, contractor name and
# coordinates are deliberately not selected: this site publishes derived
# statistics and the queries behind them, never rows identifying a household.
curl -s -G 'https://data.seattle.gov/resource/c87v-5hwh.csv' \
--data-urlencode '$select=permitnum,issueddate,estprojectcost,description' \
--data-urlencode "\$where=permittype='Single-Family/Duplex Furnace' \
AND permitclass='Single Family/Duplex' \
AND issueddate >= '2023-01-01' \
AND issueddate < '2026-08-01'" \
--data-urlencode '$limit=50000' > seattle_furnace.csv2. What it measures — and what it quietly does not
First the test that killed our Los Angeles re-roof record: is this a price, or a rate table wearing a dollar sign? Across the 5,887 furnace-only filings there are 1,211 distinct amounts, the ten commonest holding 53.7% of the cohort — $6,000 at 13.37%, $5,000 at 8.65%, $7,500 at 7.66%. That concentration is real and worth printing, but its shape is human rounding rather than a schedule: a fee table does not put its three commonest values at three different round thousands, and it does not drift, while this median climbs every year of the file without reversing. We treat the field as a declared price.
Now the limit that decides what this record can be, and it is severe. Our furnace band is published as three efficiency tiers, and Seattle's filings almost never say which one was installed. Of 5,887 furnace-only filings, 68 (1.2%) mention a rating of 90% or above or the word condensing, 43 (0.7%) mention an 80-something percent rating, and 228 (3.9%) state a BTU input of any kind. A tier-by-tier check is not available here at any sample size worth reporting. This record can only ask whether the ladder as a whole reaches the distribution.
Three more things it does not measure, and two of them cut against us. The declared amount is filed at application, before the job is built. Only permitted work appears, and an unpermitted like-for-like swap is invisible — which biases what remains toward larger, professional jobs. And the free-text description is a sentence, not a scope: a filing reading “replace gas furnace” may also have carried venting, a condensate pump or gas-line work that nobody typed. The exclusion list below removes named bundles, not unnamed ones.
One thing it does measure, unexpectedly, is the brand mix. Only 457 of the 8,667 filings whose text says furnace name a manufacturer at all, and among those 240 say Trane, 86 say Lennox and 11 say Goodman. Our equipment anchors are Goodman and Goodman-built ACiQ list prices. That is disclosed in our data file and it is the cheapest major brand in a market that, where it says anything, is mostly buying something else.
3. The cohort, and what we dropped
The permit type holds 97,312 filings in all, 96,639 of them classed Single Family/Duplex, going back to 2002-07-15. Restricting to filings issued from 2023-01-01 up to 2026-08-01 leaves 26,963, of which 26,338 — 97.7% — carry a positive estprojectcost.
Then the description has to be read, and the first surprise is that most of it is not about furnaces. 17,671 of the 26,338 filings never use the word, and 14,462 of those describe a heat pump, a mini-split or a ductless system. Seattle is electrifying inside a permit bin still named for the appliance being replaced, which is worth knowing before anyone reads this file as a furnace market. Another 1,133 are fireplaces, stoves and inserts, and 619 are air handlers with no furnace named.
Of the 8,667 filings that do say furnace, we drop four groups: 2,279 that also name cooling equipment — a heat pump, an air conditioner, a condenser, a coil, an air handler — because a permit prices everything permitted; 182 naming oil, electric, wall or floor furnaces, which are not the machine our band prices; 178 bundled with other scope such as new construction, an ADU, a remodel, a water heater or a gas line; 34 naming more than one furnace; and 107 with no replace-or-install verb at all. What survives is n = 5,887.
# local narrowing, applied to seattle_furnace.csv
cool  = r'(?i)heat\s*pump|mini[\s-]*split|ductless|\bhp\b|air\s*handler|\bahu\b|'
        r'air\s*condition|\ba/?c\b|condenser|cooling|mitsubishi|daikin|fujitsu'
noise = r'(?i)fireplace|insert|wood\s*stove|pellet|gas\s*log|water\s*heater|dryer|'
        r'range\s*hood|bath\s*fan|exhaust|boiler|radiant|\badu\b|new\s*construction|'
        r'addition|remodel|\bpool\b|generator|gas\s*(?:line|pip)'
other = r'(?i)\boil\b|electric\s*furnace|wall\s*furnace|floor\s*furnace'
multi = r'(?i)furnaces\b|\b(?:two|three|2|3|4)\s+(?:new\s+)?furnace|\(2\)|\(3\)'
verb  = r'(?i)replac|swap|change[\s-]*out|like\s*for\s*(?:like|kind)|install'

# keep: says 'furnace', matches verb, matches none of cool/noise/other/multi
# => n 5,887 - p25 $5,000 / median $6,100 / p75 $8,000

# brand tally, run over every filing whose text says furnace (n 8,667):
# 457 name a manufacturer - Trane 240, Lennox 86, Daikin 34, Carrier 34,
# American Standard 33, Goodman 11, York 11, Rheem 6
Drop the verb requirement and the cohort becomes 5,994 filings at a median of $6,056. That is the honest sensitivity: this filter is not load-bearing, and the headline moves by less than $50 either way.
What survives reads like this, with no address or amount attached: “Like for Like Gas Furnace Replacement”, “replace 25 year old 90% efficient gas furnace with new 90% gas furnace with same btu - 115,000.”, “Furnace swap out”.
4. The distribution and our band on the same axis
| Seattle, furnace-only filings, n = 5,887 | Figure | What it is |
|---|---|---|
| p10 / p25 | $4,000 / $5,000 | Declared cost, parts plus labor |
| Median | $6,100 | Mean $6,822; maximum $95,000 |
| p75 / p90 | $8,000 / $10,000 | 1,211 distinct amounts in the cohort |
| Median by year | 2023 $6,000 · 2024 $6,328 · 2025 $6,700 · 2026 $7,000 | n = 1,525 / 1,702 / 1,776 / 884 |
| Median, 2025 onward only | $6,842 | n = 2,660 |
| Median where text says like-for-like | $7,000 | n = 864 |
| Median where text states an efficiency | 90–99% $7,000 · 80–89% $5,859 | n = 68 / 43 — indicative only |
| Our band — 80% AFUE, 80,000 BTU | $2,300 / $3,600 / $4,300 | low / typical / high, national, asOf 2026-07 |
| Our band — 96% AFUE | $2,700 / $3,800 / $4,900 | Same arithmetic, condensing tier |
| Our band — 97% modulating | $3,900 / $5,400 / $6,900 | Equipment band interpolated and flagged |
| Filings at or above each tier's high | 80% 5,135 (87.2%) · 96% 4,935 (83.8%) · 97% 2,360 (40.1%) | $4,300 / $4,900 / $6,900 |
| Filings at or below our 80% typical | 501 (8.5%) | $3,600 |
The published tiers round the arithmetic to the nearest hundred. Unrounded, from our own data file, they are $2,342 / $3,576 / $4,329, $2,720 / $3,786 / $4,860 and $3,920 / $5,350 / $6,940 — furnace list price times the 1.2 / 1.4 / 1.6 markup, plus furnace-only labor of $800 / $1,150 / $1,500. The percentages above are computed against the unrounded highs, which is the harder test for us by a few dollars.
Read the table from the bottom. Our 80% AFUE band was built to describe a straightforward furnace replacement, and 87.2% of Seattle's straightforward furnace replacements are at or above the top of it. Only 8.5% land at or below its typical. Even the 97% modulating tier — the most expensive rung we publish, for a machine most households do not buy — has 40.1% of the cohort at or above its ceiling.
No state adjustment is applied to those rows, and this time it is not a choice: our HVAC data carries no per-state index. It carries a sentence saying state-level billed labor scales roughly with the BLS state median wage for occupation 49-9021, “about 0.79 in the Gulf South to 1.27+ in New England/California/DC”, and no table behind it. Seattle sits at the top of that range. Applying 1.27 to the labor line alone would lift our 80% typical from $3,576 to $3,887, which does not begin to reach $6,100.
5. Verdict
Verdict
(B) Band moved — the furnace-only band is too low, and this record cannot say which of its three tiers is the one at fault.
The finding is not marginal and it is not built on a thin sample. On 5,887 filings the median declared cost of replacing a furnace and nothing else is $6,100, against a band whose most expensive tier tops out at $6,900 and whose ordinary tier tops out at $4,300. The direction has one defence that this file cannot rule out — Seattle is an expensive city and our HVAC data has no state index to correct with. That is why this record is published alongside a Kansas City record pulled the same day, in a market nobody calls expensive, where the same band fails the same way.
What this record cannot do is repair anything. A band with three rungs cannot be corrected by a file that states the rung on 1.9% of its rows. The two thin subsets that do state one point the same direction — $7,000 where the text says 90% or condensing, $5,859 where it says 80-something — and at 68 and 43 filings they are printed as shape, not as evidence. The correction that follows is argued from the Kansas City record, which states the efficiency on 71% of its filings, and Seattle's role is to establish that the gap is large and not a small-sample artefact.
Printed above is the band as it stood at the check: our HVAC pricing data is stamped 2026-07, this record was retrieved 2026-08-11. Nothing here is edited afterwards; the change to the data is dated below as its own entry.
6. If you are getting furnace quotes in Seattle
Make the bid say what the permit will say, and then some. Ask for the make, model and AFUE rating in writing, because that single line is what separates a $4,000 job from a $9,000 one and it is the line Seattle's own permit file almost never records. Ask whether the new unit is condensing, and if it is, ask for the PVC intake and exhaust runs, the condensate drain and any chimney relining to be priced as their own items rather than folded into a lump sum — that is the connected work that turns a one-day job into two. Ask whether the permit fee is inside the number. Then look the permit up yourself: the same endpoint returns the amount your installer declared to the city as fair market value for your job, and comparing it to your contract costs nothing. If you are being sold a heat pump instead, note that this is now the larger half of the same permit bin, and our heat pump comparison runs the operating-cost math. Our HVAC system calculator prices the combined furnace-and-AC change-out line by line.
Frequently asked questions
How much does it cost to replace a furnace in Seattle?
The median declared cost on a single-family permit that describes a furnace replacement and nothing else is $6,100, across 5,887 filings issued between January 2023 and July 2026. The quartiles are $5,000 and $8,000, the 10th percentile is $4,000 and the 90th is $10,000. Those are amounts the installer declared to the city as fair market value, parts plus labor, at the time of application — not invoices, and not a national figure. The trend inside the file is upward without a reversal: the median runs $6,000 in 2023, $6,328 in 2024, $6,700 in 2025 and $7,000 across the first seven months of 2026.
Why doesn't this record tell you which efficiency tier is wrong?
Because Seattle's scope text is typed by whoever pulls the permit, and almost nobody types the efficiency. Of the 5,887 filings, 68 mention a rating of 90% or higher or the word condensing, 43 mention an 80-something percent rating, and 228 state a BTU input of any kind — 1.2%, 0.7% and 3.9% respectively. Our band is published as three tiers that differ only by the furnace inside them, so without that word the record can compare against the ladder as a whole and not against any rung of it. The two thin subsets that do state a rating point the same way as everything else, at $7,000 and $5,859, but 68 and 43 filings decide nothing.
Is this just Seattle being expensive?
Partly, and our own data cannot say how much. Our HVAC file carries no per-state index at all — only a note that state-level billed labor scales roughly with the BLS state median wage for HVAC mechanics, from about 0.79 in the Gulf South to 1.27 and up in New England, California and DC. Washington sits at the high end of that range, so some of the gap is the city. What the city does not explain is the size of it: our 80% AFUE band tops out at $4,300 and 87.2% of Seattle's filings are at or above that, with the median well clear of it. This is why the record is published next to a Kansas City one rather than alone.
What is our furnace band, and where did it come from?
For the common 80,000 BTU size we publish three installed tiers: 80% AFUE at $2,300–$4,300, typical $3,600; 96% AFUE at $2,700–$4,900, typical $3,800; and 97% modulating at $3,900–$6,900, typical $5,400. Each is built the same way — a published distributor list price for the furnace, times a disclosed 1.2 to 1.6 contractor markup, plus 8 to 12 crew-hours at $75–150 an hour. The equipment anchors are Goodman and Goodman-built ACiQ units, which matters here: of the 457 Seattle filings that name a brand at all, 240 say Trane, 86 say Lennox and 11 say Goodman. The band is priced on the cheapest major brand in a market that is mostly buying something else.