Two cities that write the trade into the record — and a band that cannot survive them
Published 2026-08-11 · records retrieved 2026-08-11 · our band fixed as of 2026-08 · how we build these numbers
Run your own numbers in the electrical panel calculator →
Our Chicago permit record ended owing a debt. It cut the high of our permit and inspection band from $400 to $350 because $400 was above every source cited for it, and then said plainly what it could not do: “What this record cannot do is set the replacement values, and we will not invent them; that needs a second jurisdiction on a different fee basis.” This record pays that debt with two, and a third file for corroboration.
Both cities do something Chicago only did by accident of templating: they name the trade and the work in structured columns. Norfolk files a permit whose type is Electrical and whose work type is literally Service Upgrade. New Orleans files one typed Electrical Service / Circuit / Feeder. Neither requires a regular expression over free text, so there is no scope-text filter to argue about — the argument our Los Angeles and San Francisco roofing records both died on.
1. What this record is
Two datasets, retrieved on 2026-08-11.
Norfolk, Virginia. Resource fahm-yuh4, published by the Department of City Planning's Development Services Center, refreshed daily by an automated workflow per its own metadata. The columns that matter are type, work_type, use_type, issue_date, total_fee, total_payments and total_balance. Its Socrata row timestamp read 2026-08-11T11:15:25Z at retrieval. It declares no license. The dataset metadata carries no licenseId field at all, and we could find no terms-of-use page on the portal — only a privacy policy. We therefore treat it the way we treated Everett in our water-heater record: publish derived statistics and the queries behind them, reproduce no rows, and say here that the licensing is unverified rather than let the silence pass as permission.
New Orleans, Louisiana. Resource rcm3-fn58, published by the Department of Safety and Permits. This one is the cleanest licence we have yet worked with: the metadata declares Creative Commons 1.0 Universal (Public Domain Dedication) — CC0 — which waives copyright outright. Its row timestamp read 2026-08-11T04:52:01Z. The columns used are type, landuse, issuedate and totalfees.
Four queries reproduce every number below. All carry an upper date bound so the window cannot grow with the calendar:
# Norfolk: the fee distribution on residential service upgrades
curl -s -G 'https://data.norfolk.gov/resource/fahm-yuh4.json' \
  --data-urlencode '$select=total_fee,count(1) as n' \
  --data-urlencode "\$where=type='Electrical' AND work_type='Service Upgrade' \
                    AND use_type='One/Two Family Dwelling' \
                    AND issue_date >= '2020-01-01' AND issue_date < '2026-08-01'" \
  --data-urlencode '$group=total_fee' \
  --data-urlencode '$order=total_fee' \
  --data-urlencode '$limit=50000'

# same query with work_type='New Service' gives the second Norfolk cohort
# Norfolk: was the fee actually collected?
curl -s -G 'https://data.norfolk.gov/resource/fahm-yuh4.json' \
--data-urlencode '$select=count(1) as n,sum(total_fee) as fees,sum(total_payments) as paid,sum(total_balance) as owed' \
--data-urlencode "\$where=type='Electrical' \
AND (work_type='Service Upgrade' OR work_type='New Service') \
AND use_type='One/Two Family Dwelling' \
AND issue_date >= '2020-01-01' AND issue_date < '2026-08-01'"
# => [{"n":"2174","fees":"260086.86","paid":"259146.34","owed":"940.52"}]# New Orleans: the fee distribution on residential electrical service permits
curl -s -G 'https://data.nola.gov/resource/rcm3-fn58.json' \
--data-urlencode '$select=totalfees,count(1) as n' \
--data-urlencode "\$where=type='Electrical Service / Circuit / Feeder' \
AND (landuseshort='RSFD' OR landuseshort='RSF2') \
AND issuedate >= '2023-01-01' AND issuedate < '2026-08-01'" \
--data-urlencode '$group=totalfees' \
--data-urlencode '$order=totalfees' \
--data-urlencode '$limit=50000'2. What it measures — and what it quietly does not
Both columns are fees the city charged, not costs a homeowner reported, so the self-reporting problem that killed our Los Angeles re-roof record does not arise. Norfolk goes further and lets us check collection: on the 2,174 filings in both electrical cohorts the city assessed $260,086.86 and received $259,146.34, leaving $940.52 outstanding — 0.36%. The assessed fee and the collected fee are the same number to within a rounding error, which is worth establishing before anyone builds an argument on the word total.
Three things neither file measures, all cutting against us. Neither states whether inspection is billed inside the permit or separately, so if either city bills re-inspections on their own ticket the real cost of “permit and inspection” is above what we print. Norfolk's work_type distinguishes a Service Upgrade from a New Service but never says the amperage, so we cannot tell a 100-to-200 amp step from a 200-to-400; our band does not vary with amperage either, which is the only reason that is tolerable. And New Orleans's type bundles Service with Circuit and Feeder in one label, so its cohort is wider than a service upgrade alone — a point we return to below, because it cuts the other way.
Unpermitted work is invisible in both, as always.
3. The cohort, and what we dropped
Norfolk. The file holds 4,825 filings typed Service Upgrade or New Service across all use types. Restricting to One/Two Family Dwelling leaves 3,998 and drops 827: 636 commercial, 175 multi-family and 16 manufactured homes. Restricting to issue dates from 2020-01-01 leaves 2,174 and drops a further 1,824 issued between 2014-09-23 and the end of 2019 — six-year-old fees against a 2026 band are the same staleness objection we raised against NYSERDA and Providence, and we apply it to ourselves here. That leaves 1,557 service upgrades and 617 new services, which we keep apart because their medians differ by more than two to one.
New Orleans. The file holds 10,717 filings typed Electrical Service / Circuit / Feeder issued from 2023-01-01 to 2026-08-01. Restricting the land use to Single Family and Two-Family leaves 6,857 and drops 3,860 — business use, multi-family and unknown. We took the shorter window here deliberately: the file reaches back to 2012, and a 2012 fee has no business in a 2026 comparison.
Now the part we would rather not print. New Orleans's type label bundles circuits and feeders in with services, so its cohort contains jobs smaller than ours as well as jobs the size of ours. That should drag its median down relative to a pure service-upgrade cohort, and its median is the higher of the two cities. So the bundling does not explain the gap between them; it means New Orleans's pure-service median is probably higher still than the $119.50 we print, and every comparison below flatters our band by however much that is.
4. The distributions, and our band on the same axis
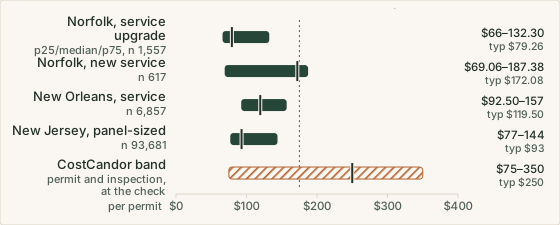
| Cohort | p25 / median / p75 | What else it says |
|---|---|---|
| Norfolk, service upgrade — n = 1,557 | $66.00 / $79.26 / $132.30 | p90 $187.40, p95 $229.20, mean $107.47 |
| Norfolk, new service — n = 617 | $69.06 / $172.08 / $187.38 | p90 $221.26, mean $150.34 |
| New Orleans, service/circuit/feeder — n = 6,857 | $92.50 / $119.50 / $157.00 | p90 $190.00, p95 $256.00, mean $142.37 |
| Commonest single value | Norfolk $66.00 · New Orleans $100.00 | 689 filings (44.25%) · 753 filings (10.98%) |
| Smallest and largest fee seen | Norfolk $15.00 to $1,111.54 | New Orleans $39.40 to $5,830.00 |
| Distinct fee values in the cohort | Norfolk 248 · New Orleans 275 | Top twelve carry 70.52% and 52.60% |
| Filings at or above our low, $75 | 51.51% · 81.41% | Chicago's figure was 100% |
| Filings at or above our typical, $250 | 3.53% · 5.09% | At or above our high, $350: 0.58% · 3.34% |
| Our band — permit and inspection | $75 / $250 / $350 | low / typical / high, national, asOf 2026-08 |
Neither city is drifting. Norfolk's service-upgrade median by year of issue reads $86.40, $89.46, $76.20, $79.26, $75.18, $86.40 and $66.00 from 2020 to 2026, on 157, 207, 280, 263, 244, 191 and 215 filings. New Orleans's reads $130.00, $131.50, $107.50 and $103.00 from 2023 to 2026, on 1,679, 1,389, 2,099 and 1,690. Six calendar years in one city and four in the other, and nothing crosses $135.
No state adjustment is applied to our row, and the rule is our own data file's: the state index applies to labor components only… equipment and permit bands vary less by state. Breaking it here would change nothing worth having. Virginia's electrician index is 1.00 and Louisiana's 0.97, so an adjusted typical would land within 3% of the unadjusted one in both cities — still above 94% of their filings, and still a labor correction applied to a line that is not labor.
The third file, and why it does not rescue the typical
New Jersey publishes every construction permit in the state with the fee split by subcode, which lets us isolate an electrical-only residential permit across 530 municipalities without any text matching at all. That file is the subject of our plumbing permit record; here is what its electrical subcode says.
# New Jersey: residential permits whose only trade fee is electrical
curl -s -G 'https://data.nj.gov/resource/w9se-dmra.json' \
  --data-urlencode '$select=totalfee,count(1) as n' \
  --data-urlencode "\$where=usegroup='R-5' AND permittype='06' \
                    AND permitdate >= '2023-01-01' AND permitdate < '2026-07-01' \
                    AND electfee > 0 AND buildfee = 0 AND plumbfee = 0 \
                    AND firefee = 0 AND elevfee = 0" \
  --data-urlencode '$group=totalfee' \
  --data-urlencode '$order=totalfee' \
  --data-urlencode '$limit=50000'

# add:  AND constcost >= 800 AND constcost <= 3000
# for the panel-sized subset described below
Across 341,986 filings the electrical subcode fee alone has a median of $80 and a single commonest value of $75.00, paid on 60,013 of them — 17.55%, and the same figure Chicago's file produced from a completely unrelated fee table. But the amount actually collected includes the state training fee and any municipal charge, and on that basis the all-in median is $166, with a 75th percentile of $241 and a 90th of $331. On that reading 23.03% of New Jersey filings reach our $250 typical and 8.53% reach our $350 high, which is far friendlier to our band than either city above.
So we narrowed it, and the window came from our own data rather than from the fee column. Our electrical panel file publishes two panel jobs: a like-for-like replacement from $800 and a 100-to-200 amp service upgrade up to $3,000. Filings whose declared construction cost falls in that window are panel-sized work rather than the solar arrays, generators and EV circuits that also file an electrical-only permit in New Jersey. That subset is 93,681 filings, and its all-in fees run $77 / $93 / $144 at the quartiles, with a 90th percentile of $203 and a 95th of $254. Our typical is reached by 5.47% of it and our high by 1.58%.
Both New Jersey readings are printed because the choice between them changes the answer, and we use the narrow one for the same reason Chicago used its narrow one: it is the cohort that matches the job our band prices.
5. Verdict
Verdict
(B) Band moved — the typical falls from $250 to $175, which is the lowest figure our own three sources can produce, and is still too high.
Four independent fee tables now sit against this band. Chicago's put our typical at the 98.3rd percentile of its filings. Norfolk's puts it at the 96.5th, New Orleans's at the 94.9th, New Jersey's panel-sized cohort at the 94.5th. A figure that four unrelated municipal schedules place above 94% of everything they collect is not a typical, and the fact that our own source line never supported it — only one of the three cited ranges even has $250 as an endpoint — means there is nothing left holding it up.
The replacement is built from our sources and not from the permit files, because that is the only way a correction stays honest when the evidence and the citations disagree. This Old House gives $50–$300, HomeGuide $250–$350, Angi $50–$300. Their midpoints are $175, $300 and $175, and the median of those three is $175. Every source contributes; none is discarded; the permit files are not consulted for the value at all. What they did was establish that the old number could not stand.
The low stays at $75 and the high stays at $350, and both need a sentence. $75 is not the floor Chicago made it look like — 48.5% of Norfolk's service upgrades and 18.6% of New Orleans's electrical services cost less than that — but it sits close to the lower quartile in all three files ($66.00, $92.50, $77), which is what a low is for. $350 is the maximum of every source cited and was already cut once; cutting it again on this evidence would mean setting a national ceiling from three cities.
And the correction does not close the gap. At $175 our typical is still the 88.3rd percentile in Norfolk and the 85.9th in New Orleans. The residual is not a rounding error, it is a message about the sources: contractor cost guides quote permit fees far above what city treasurers collect, and every band on this site that is built from those guides inherits that. The band above is printed as it stood at the check, at its 2026-08 stamp; the correction is dated beneath it in the data file, never written over it.
6. If you are pulling an electrical permit
Look up your own city's fee schedule before you accept a permit line on a bid, because these are ordinances and they are published. In Norfolk and New Orleans you can go further and look up the permit itself: both endpoints above return the fee charged on any filing, so a bid carrying a $400 permit line in a city whose commonest electrical fee is $66.00 is a question you can ask with the file open. Ask whether the permit is passed through at cost or marked up, and what a failed inspection costs to re-run — that is the likeliest way a two-figure line becomes a three-figure one. And do not carry any of these numbers to a third city. The whole finding of this record is that four cities agreed our band was too high and disagreed with each other about almost everything else. Our panel calculator itemises the rest of the job, and the EV charger guide covers the case where a charger is what forces the upgrade.
Frequently asked questions
How much is an electrical service permit in Norfolk or New Orleans?
In Norfolk the median total fee on a one- or two-family service upgrade is $79.26 across 1,557 permits issued from January 2020 to July 2026, and $66.00 is at once the 10th percentile, the 25th and the single commonest value, paid on 689 of them. A new service rather than an upgrade runs a median of $172.08 across 617 filings. In New Orleans the median on a single- or two-family electrical service, circuit or feeder permit is $119.50 across 6,857 filings issued since January 2023, with a 25th percentile of $92.50 and a 75th of $157.00. Both are schedules, not markets: 12 values carry 70.52% of the Norfolk cohort and 52.60% of the New Orleans one.
Why did the typical move to $175 and not to something closer to what these cities charge?
Because a band is only allowed to move to a number its own sources can produce. Our data file cites three cost guides for this line: This Old House at $50–$300, HomeGuide at $250–$350 and Angi at $50–$300. Take the midpoint of each and you get $175, $300 and $175; the median of those three is $175. That construction uses all three sources, discards none of them, and is not read off the permit files at all. What the permit files did was establish that $250 could not stand: it sits at the 96.5th percentile in Norfolk and the 94.9th in New Orleans. $175 is still high against both — the 88.3rd and 85.9th percentiles — and we are printing that rather than hiding it, because the honest reading is that contractor cost guides quote permit fees well above what municipalities actually collect.
Doesn't the Chicago record say $75 is a hard floor?
It says $75 was Chicago's outright minimum across 4,114 filings, and that was true of Chicago. It is not true anywhere else we have looked. In Norfolk 48.5% of service-upgrade filings pay less than $75, and the commonest fee in the city is $66.00. In New Orleans 18.6% pay less than $75. In New Jersey's electrical subcode, 28.4% of 341,986 residential filings are under $75. Our low stays at $75 because it is close to the lower quartile in all three files — Norfolk's 25th percentile is $66.00, New Orleans's is $92.50, New Jersey's panel-sized cohort is $77 — but reading Chicago's coincidence as a national floor would have been exactly the mistake this ledger exists to catch.
What can two cities not tell you?
Where a national middle belongs. Norfolk prices this permit off a schedule whose commonest value is $66.00 and New Orleans off one whose smallest observed fee is $39.40, and neither has any relation to the other or to Chicago's circuit-count table. What the three of them together can do is rule out a value: a figure that sits above 94% of every distribution we have opened is not a typical, whatever the guides say. That is enough to move the band and not enough to set it. Setting it properly needs a published national schedule of collected permit fees, which as far as we can find does not exist — the closest thing our own file cites is a 27-city survey on a different trade, and our New Orleans water-heater record shows what happens when you read one of those as a band.