A band built on four words — and a state that publishes 528 answers to them
Published 2026-08-11 · records retrieved 2026-08-11 · our band fixed as of 2026-08 · how we build these numbers
Run your own numbers in the repipe calculator →
Our repipe calculator adds a permit line of $75 low, $350 typical, $800 high to every estimate it produces. The entire justification in our data file is one sentence: 2026 repipe guides: plumbing permit $50-$800 depending on municipality.
Four of those words are a testable claim. If the fee depends on the municipality, then somewhere there ought to be a file with a lot of municipalities in it. The state file carries 561 municipality codes, all administering one state construction code, all filing to one schema, and the state publishes the result with the fee split by trade subcode. That last part is what makes this record possible: a permit whose electrical, building and fire fees are all zero and whose plumbing fee is positive is a plumbing permit, and no scope text has to be read to know it.
1. What this record is
The dataset is w9se-dmra, NJ Construction Permit Data, published by the New Jersey Department of Community Affairs, Division of Codes and Standards through the state open-data centre. Its metadata declares licenseId: PUBLIC_DOMAIN, states a monthly posting frequency and statewide geographic coverage, and warns that most data older than five years is purged. Its Socrata row timestamp read 2026-07-08T20:40:54Z when we pulled on 2026-08-11, which is why every query below stops at 2026-07-01.
The columns used are comu and muniname (municipality), county, usegroup, permittype, permitdate, constcost, and the fee columns: buildfee, plumbfee, electfee, firefee, elevfee, dcafee, certfee, otherfee and totalfee. There is no street address, no owner name, no applicant name and no contractor column anywhere in the file's 47 fields — the closest it comes is a block and lot pair, which identifies a parcel to anyone holding the municipal tax map but names nobody. That is the least identifying permit file we have opened, and we still publish only derived statistics and the queries behind them.
Two queries reproduce everything below:
# the fee distribution on residential plumbing-only permits
curl -s -G 'https://data.nj.gov/resource/w9se-dmra.json' \
  --data-urlencode '$select=totalfee,count(1) as n' \
  --data-urlencode "\$where=usegroup='R-5' AND permittype='06' \
                    AND permitdate >= '2023-01-01' AND permitdate < '2026-07-01' \
                    AND plumbfee > 0 AND buildfee = 0 AND electfee = 0 \
                    AND firefee = 0 AND elevfee = 0" \
  --data-urlencode '$group=totalfee' \
  --data-urlencode '$order=totalfee' \
  --data-urlencode '$limit=50000'

# add   AND constcost >= 6600 AND constcost <= 28600
# for the repipe-sized subset; add muniname to $select and $group
# for the per-town medians
# what the cohort is made of, and who is in it
curl -s -G 'https://data.nj.gov/resource/w9se-dmra.json' \
--data-urlencode '$select=count(1) as n,count(distinct comu) as towns,count(distinct county) as counties,sum(plumbfee) as plumb,sum(dcafee) as dca,sum(otherfee) as other,sum(certfee) as cert,sum(totalfee) as total,sum(constcost) as cost' \
--data-urlencode "\$where=usegroup='R-5' AND permittype='06' \
AND permitdate >= '2023-01-01' AND permitdate < '2026-07-01' \
AND plumbfee > 0 AND buildfee = 0 AND electfee = 0 \
AND firefee = 0 AND elevfee = 0"
# => n 123619 · towns 528 · counties 21 · plumb 12012287 · dca 799413
# other 244037 · cert 8957 · total 13261496 · cost 5455167142. What it measures — and what it quietly does not
Three separate charges land on one New Jersey permit and the applicant pays all three, so we compare against totalfee rather than the plumbing line alone. Across this cohort the plumbing subcode fee is $12,012,287, the state training fee is $799,413 — it is proportional to declared construction cost, and works out to about $1.47 per $1,000 of the $545,516,714 declared — municipal charges add $244,037 and certificate fees $8,957. Those four sum to $13,064,694 against a stated total of $13,261,496: 98.5%. The missing 1.5% has no column of its own, and 2,025 filings — 1.64% of the cohort — carry a totalfee that is not the sum of the parts we can see. We use the stated total anyway, because it is the number the state says was charged, but a reader rebuilding it from components will not land exactly on ours.
The limit that decides what this record can be: there is no work description anywhere in the file. A plumbing-only residential alteration permit might be a whole-house repipe, a water heater, a bathroom, or one leaking valve, and nothing in 47 columns distinguishes them. What the file does carry is constcost, the declared cost of the work, and that is the only handle we have. It is the same handle our Los Angeles re-roof record refused to trust — a declared valuation is self-reported — with one difference that matters here: in New Jersey the plumbing fee is not computed from the declared cost, so the incentive to under-declare does not point at the number we are measuring.
And the file records what a municipality collected, not what it charges. A town that waived fees for storm repairs, or that files a $0 permit for its own housing authority, appears here as a cheap town.
3. The cohort, and what we dropped
The population is every permit issued from 2023-01-01 up to 2026-07-01 in use group R-5 — the International Residential Code group, one- and two-family dwellings, 1,953,743 filings statewide — under permit type 06, Alteration, whose plumbing subcode fee is positive and whose building, electrical, fire and elevator fees are all zero. That is 123,619 filings across 528 municipalities and all 21 counties, dated 2023-01-02 to 2026-06-30, on 978 distinct fee values.
We dropped the whole file before 2023 rather than take the ten-year window the data allows, for the reason given above: the state purges most rows past five years, so the early period is a survivor sample rather than a record.
Then the narrowing, and its window comes from our own calculator rather than from the fee column. Our repipe file publishes two whole-house scenarios: a 1,500 square foot, two-bath PEX job at $6,600–$13,800 including permit, and a 2,000 square foot, two-and-a-half bath house at $7,600–$15,800 in PEX or $15,800–$28,600 in copper. Filings whose declared construction cost falls between $6,600 and $28,600 are therefore repipe-sized by our own published definition, fixed before we looked at a single fee. That subset is 14,653 filings across 496 municipalities, dated 2023-01-03 to 2026-06-30.
We print both, and use the narrow one, because the wide one contains the water-heater swaps and single-fixture repairs our band does not price.
4. The distribution, and our band on the same axis
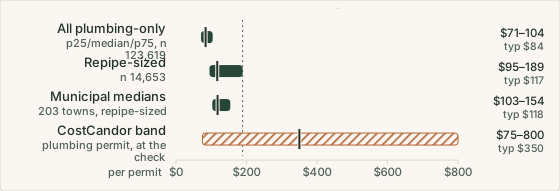
| Cohort | p25 / median / p75 | What else it says |
|---|---|---|
| All plumbing-only residential — n = 123,619 | $71 / $84 / $104 | p10 $56, p90 $160, p95 $210, mean $107.28 |
| Repipe-sized by our own definition — n = 14,653 | $95 / $117 / $189 | p10 $81, p90 $300, p95 $401, mean $168.25 |
| Municipal medians, all filings | $77 / $85 / $100 | 386 towns with 50+ filings; range $41 to $203 |
| Municipal medians, repipe-sized | $103 / $118 / $154 | 203 towns with 20+ filings; range $65 to $615 |
| Filings at or above our low, $75 | 72.48% · 96.25% | all filings · repipe-sized |
| Filings at or above our typical, $350 | 1.63% · 7.15% | 2,017 and 1,047 filings |
| Filings at or above our high, $800 | 0.27% · 0.87% | 339 and 127 filings |
| Largest fee in each cohort | $85,305 · $9,019 | both on single filings; the tail is thin and long |
| Our band — plumbing permit | $75 / $350 / $800 | low / typical / high, national, asOf 2026-07 |
The row worth staring at is the third one. Our band's justification is the phrase depending on municipality, and here are the municipalities: 386 of them that issued at least 50 of these permits, with medians running from $41 to $203. Our typical of $350 is above every one of them. Widen the tolerance to the repipe-sized cohort, where small towns fall out of the sample and the remaining 203 have medians from $65 to $615, and $350 is still above the 75th percentile of the towns. The claimed spread of $50 to $800 is not what the ordinances do; it is roughly four times wider than what they do.
Our low survives, and it survives properly rather than by width. On repipe-sized filings 96.25% are at or above $75, which is what a low is supposed to mean. On the wider cohort only 72.48% are, and that is the right answer too: a single-fixture permit costs less than a whole-house one, and our band is not pricing single fixtures.
5. Verdict
Verdict
(B) Band moved — the typical falls from $350 to $189 and is flagged as the interpolation it always was. The low and the high are left where they are.
The typical had to move because nothing was holding it. The band's source sentence gives a low and a high and no middle, so $350 was never read off anything; and if you insist on deriving a middle from that sentence alone, the only candidate is its midpoint, $425, which 95.62% of repipe-sized New Jersey filings fall below. A figure that its own basis can only push in the wrong direction is not a figure with a basis.
So the new value is read off the evidence, and at the most conservative point in it. $189 is the 75th percentile of the repipe-sized cohort — not its median, $117, which is what a straightforward reading would give. We took the higher of the two on purpose: one state cannot set a national middle, a correction should be the smallest one the evidence forces, and $189 is the 75th percentile by construction, so 74.89% of these filings are below it already. The data file now carries interpolated: ["typical"] on this band, which it should have carried from the first day, and the reasoning is written into the same field.
The low stays at $75 because 96.25% of repipe-sized filings are at or above it. The high stays at $800 because $800 is the top of the range our own source states, and our Chicago record established the rule we are following: a band value that sits above every source cited for it has to move, and one that sits at a cited endpoint does not, however rarely it is reached. New Jersey reaches $800 on 127 repipe-sized filings, and a national high is allowed to describe the expensive tail.
What this cannot do is settle the figure. It is one state, and states administer construction codes differently enough that the phrase depending on municipality could easily mean something else in Texas. The band above is printed as it stood at the check, at its 2026-07 stamp; the correction is dated beneath it in the data file, never written over it.
6. If you are pulling a plumbing permit
If you are in New Jersey, look your own town up: add muniname to the queries above and you will get the fee distribution for the office you are about to file with, on filings issued in the last three years. That is a better number than any national band, ours included. Everywhere else, ask the plumber for the permit number after the job is filed and check the fee against the contract line — permit fees are set by ordinance and published, so a marked-up permit line is one of the few items on a repipe quote you can verify from outside. Ask, too, whether the quote includes the permit at all: our calculator adds it, many quotes do not, and the difference is small enough to be forgotten and large enough to argue about. Our repipe calculator itemises the rest, and the slab leak guide covers the foundation case that changes how the pipe gets routed.
Frequently asked questions
How much is a residential plumbing permit in New Jersey?
Across 123,619 permits issued between January 2023 and June 2026 whose only trade fee is the plumbing subcode fee, on one- and two-family dwellings, the median total collected is $84. The quartiles are $71 and $104, the 90th percentile is $160 and the 95th is $210. Narrow it to filings whose declared construction cost is repipe-sized — $6,600 to $28,600, the span our own calculator publishes for a whole-house repipe — and the median rises to $117, with quartiles of $95 and $189. Fees are set by each municipality, and across the 386 towns that issued at least 50 of these permits the municipal medians run from $41 to $203.
Why did the typical move to $189?
Because the old figure had nothing behind it and the new one has 14,653 filings behind it. Our data file justifies this band with a single sentence — plumbing permit $50 to $800 depending on municipality — which contains a low and a high and no middle at all. The only value that sentence can generate on its own is its own midpoint, $425, and 95.62% of repipe-sized New Jersey filings fall below that. So the correction is read off the evidence instead, at the most conservative point that evidence supports: $189 is the 75th percentile of the repipe-sized cohort. We did not use its median, $117, because one state cannot set a national middle and a correction should be the smallest one the evidence forces. The new figure is flagged interpolated in the data file, which the old one never was.
Why is a plumbing permit in New Jersey not just the plumbing fee?
Because three charges land on the same permit and the applicant pays all of them. The plumbing subcode fee is the largest — $12,012,287 of the $13,261,496 collected across this cohort — but the state adds a Department of Community Affairs training fee proportional to the declared construction cost, $799,413 across the cohort, or about $1.47 per $1,000 of declared work, and municipalities add their own charges on top, $244,037. We compare against the total because that is what a household writes a cheque for. Reading only the plumbing subcode fee would flatter our band by roughly a tenth.
Doesn't one state prove very little about a national band?
It proves less than 528 municipalities sounds like and more than one city would. Every one of those fee schedules is a separate ordinance, which is exactly the variation the phrase depending on municipality is claiming to cover, and the observed variation is nothing like the claim: municipal medians span $41 to $203 where our band spans $50 to $800. What New Jersey cannot tell you is whether a state with a different code administration prices this differently, and it plainly does — our Norfolk and New Orleans record found electrical service permits with commonest values of $66.00 and $100.00 in two cities with no relation to each other. So this is a first correction and not a settled figure, and the file now says so.