We built San Francisco the denominator it was missing
Published 2026-08-11 · records retrieved 2026-08-11 · our band fixed as of 2026-07 · how we build these numbers
Run your own numbers in the roof replacement calculator →
On 2026-08-05 we opened San Francisco's building permit file, found 5,527 re-roof filings, and threw the record out in one sentence: 94% of them state no roof size, so there is no denominator to price against. By then our own ledger was describing the roofing records as a set — filings that carried the number and no denominator — and the sentence had started to sound less like a finding and more like an excuse.
It was. San Francisco publishes the denominator; it just publishes it in a different file. The Assessor-Recorder's secured property tax roll gives a building area and a storey count for every parcel in the city, keyed by the same block and lot the permit already carries. Two hundred thousand rows, one exact join, no address matching. After the join, 3,392 single-family re-roof filings have a declared cost and a roof area.
They are still unusable, and the reason has moved. The declared cost in this file barely responds to the size of the roof at all: the rank correlation between them is 0.14, and cost per square falls by half across the size range without anything about roofing changing. We built the denominator and discovered the numerator was the worse half.
1. What this record is
Two datasets, joined, both from the City and County of San Francisco open-data portal, both under the Open Data Commons Public Domain Dedication and License. The numerator is Building Permits, Socrata i98e-djp9 — the same resource as our first San Francisco record. The denominator is the Assessor Historical Secured Property Tax Rolls, wv5m-vpq2: property_area, number_of_stories, number_of_units, lot_area and a property class code, 211,547 rows for the 2025 closed roll. Both retrieved 2026-08-11.
This is the pairing that redeemed our Cambridge record, and there the assessor's licence was merely absent. Here both files carry the same explicit dedication, which is the cleanest position we have been in.
# licence and freshness, straight from the portal metadata
for id in i98e-djp9 wv5m-vpq2; do
  curl -s "https://data.sfgov.org/api/views/$id.json" | python3 -c \
    "import sys,json,datetime as dt; d=json.load(sys.stdin); \
     print(d['licenseId'], dt.datetime.fromtimestamp(d['rowsUpdatedAt'], dt.UTC).isoformat())"
done
# => PDDL 2026-08-11T12:27:03+00:00      (permits, refreshed daily)
#    PDDL 2026-06-26T22:50:36+00:00      (tax roll, refreshed annually)
Both pulls name their columns. The permit file carries a street number, a street name and coordinates, and the tax roll carries a property location string; none of those is selected. Nothing that could identify a household is on our disk or on this site.
# the numerator. The cap on filed_date matters: this file moved the morning
# we pulled it, so without the ceiling your n will not be ours tomorrow.
curl -s -G 'https://data.sfgov.org/resource/i98e-djp9.json' \
  --data-urlencode '$select=permit_number,block,lot,description,estimated_cost,revised_cost,filed_date,status,existing_use,number_of_existing_stories' \
  --data-urlencode "\$where=filed_date >= '2020-01-01' AND filed_date < '2026-08-01' AND (lower(description) like '%re-roof%' OR lower(description) like '%reroof%' OR lower(description) like '%re roof%')" \
  --data-urlencode '$limit=40000' -o sf_roof.json

# the denominator. Owner name and property location are deliberately not selected.
curl -s -G 'https://data.sfgov.org/resource/wv5m-vpq2.json' \
  --data-urlencode '$select=block,lot,property_area,number_of_stories,number_of_units,lot_area,property_class_code' \
  --data-urlencode "\$where=closed_roll_year='2025' AND property_class_code='D'" \
  --data-urlencode '$limit=120000' -o sf_roll.json
# => 21,400 re-roof filings; 95,049 class-D 'Dwelling' parcels
2. What it measures — and what it quietly does not
The roof area is manufactured, and the recipe is ours. The assessor publishes a building area and a storey count, not a footprint and certainly not a roof. We divide the first by the second, expand the result by the standard 1.25 ft eave on a 1.5:1 rectangle, and multiply by a slope factor — all three steps taken from roofing.json, all three ours. Our Boston record, retrieved the same day, measures what that recipe costs against roofers' own square counts: it lands within 6% on one-storey houses and understates by a fifth or more on taller ones.
Nothing in the file says what pitch these roofs are. San Francisco has flat roofs and steep ones on the same block and the permit distinguishes neither. We therefore report the answer under three of our four slope options and let the reader see how much of the result is our choice: the median comes to $955 per square if every roof is flat, $902 at low slope, $812 at medium. That $143 spread is wider than the gap between our published typical and either end of our band.
A declared cost is not a contract price and the fee scales with it. San Francisco's over-the-counter alteration permit is priced off the declared valuation, so under-declaration is the direction of the incentive. Section 4 shows what these declarations look like, and they do not look like contract prices.
The tax roll is a year behind the permits. The permit file moved the morning we pulled it; the roll is the 2025 closed roll, refreshed 2026-06-26, and its own data_as_of field is earlier still. A house extended or converted since then is measured at its old size.
3. The cohort, the join, and where 21,400 becomes 3,392
The join key is exact. San Francisco's permit carries block and lot in the assessor's own zero-padded form, so the two files agree character for character — no truncation, no fuzzy address matching, and none of the unit ambiguity that cost us accuracy in Cambridge. Every loss below is a filter we chose:
| Step | Rows left | What went, and why |
|---|---|---|
| Description matches a re-roof phrase, filed 2020-01-01 to 2026-08-01 | 21,400 | The pull |
| De-duplicated to unique permit number | 20,081 | 1,319 rows are revisions of a permit already counted |
| Filed 2023-01-01 onward | 13,015 | Our band is 2026 pricing |
| Status complete or issued | 12,779 | Cancelled, withdrawn, expired and not-yet-issued filings dropped |
| A positive revised or estimated cost | 12,778 | One filing declares nothing |
| Block and lot found on the 2025 roll | 12,667 | 111 point at no parcel |
| That parcel is assessor class D, Dwelling | 8,193 | 4,474 filings: 1,513 landed on flats and duplexes, 795 on condominiums, 503 on 5-to-14-unit apartments, 336 on smaller apartments, 307 on larger, 165 on commercial stores, and 855 across smaller classes |
| Building area, storey count and a single unit on record | 8,029 | 164 parcels are incompletely described |
The permit's own existing_use is 1 family dwelling | 3,553 | The two files disagree on 4,476 parcels — see below |
| Description free of repair, partial and other-trade words | 3,432 | Patches, sections, decks, skylights, solar, garages |
| Footprint proxy fits inside the recorded lot | 3,395 | 37 parcels claim more building on the ground than they have ground |
| Footprint proxy between 400 and 6,000 sq ft | 3,392 | Three impossible rows, one of which the roll credits with 93 storeys |
The ninth row is the one to look at, and it is a warning about this whole technique. On 4,476 parcels the two files contradict each other, and on 4,464 of them the contradiction is the same one: the assessor's roll records a single-family Dwelling with one unit, and the roofer filling in the permit writes “2 family dwelling”. Somebody is wrong, we cannot tell which, and both files are the city's. We kept only the parcels where the two agree, which is the conservative cut and also a selection: houses whose paperwork agrees with itself are not a random sample of houses.
The seventh row is where the survivors acquire their skew. Restricting to detached-dwelling parcels removes two thirds of the joined filings and, in San Francisco, that means removing most of the north and east of the city. What is left leans towards the Sunset, the Richmond and the outer south — smaller, later, more uniform houses than the file as a whole.
# the join and the manufactured denominator. Every step is a choice.
roll = {(a['block'], a['lot']): a for a in assessor}     # exact, both zero-padded

AR, EAVE = 1.5, 1.25            # roofing.json aspectRatio and standard eaves, ft
PITCH    = {'flat': 1.02, 'low': 1.08, 'medium': 1.2}    # roofing.json pitchMultipliers

def squares(a, pitch):
    fp   = float(a['property_area']) / float(a['number_of_stories'])
    w, d = math.sqrt(fp * AR), math.sqrt(fp / AR)
    return (w + 2 * EAVE) * (d + 2 * EAVE) * PITCH[pitch] / 100.0

cost = lambda r: float(r.get('revised_cost') or 0) or float(r.get('estimated_cost') or 0)
# => 3,392 filings with a declared cost and a manufactured roof
4. What the denominator did to the numbers
Our asphalt architectural band is $450 / $575 / $750 per square installed and tear-off is $100 / $160 / $250, so a full strip-and-replace is $550 / $735 / $1,000. California carries a roofer-wage index of 1.15; on the roughly 65% labour share that is a multiplier of 1.0975, putting the band at $604 / $807 / $1,098.
Under the low-slope assumption the cohort's median declared cost per square is $902. Under medium slope it is $812 — five dollars from our published typical. We are not going to print that as agreement, and here are the three reasons in ascending order of seriousness.
First, we chose it. Flat gives $955, low slope $902, medium $812. Nothing in the file constrains the choice, so any of the three is available to whoever wants a particular headline.
Second, the declared costs look invented. The median is $14,000 and the quartiles are $10,000 and $19,562. 56.1% of the 3,392 declared values are exact multiples of $1,000 and 18.6% are multiples of $5,000; the five commonest values in the cohort are $10,000 (225 filings), $12,000 (195), $15,000 (173), $8,000 (112) and $9,000 (101). The descriptions match: the commonest one, on 7,517 of the 21,400 filings we pulled, is a single canned sentence about removing and replacing roofing material in kind, and a further 6,059 read simply reroofing. Our Boston record, run against the same kind of file the same day, found round thousands on 19.1% of roofing valuations. This is a different sort of number.
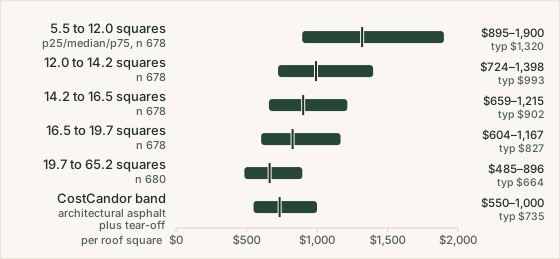
Third, and fatally: the declared cost does not respond to the roof. Least squares gives cost = $9,435 + $448 × squares with the roof explaining 3.2% of the spread; the log-log elasticity is 0.275 where a per-square price would be 1; the rank correlation is 0.14. Sort the cohort by the roof we computed and the quotient does what a quotient does when its numerator is roughly constant:
| Derived roof, squares | Rows | Declared cost per square, p25 / median / p75 |
|---|---|---|
| 5.5 to 12.0 | 678 | $895 / $1,320 / $1,900 |
| 12.0 to 14.2 | 678 | $724 / $993 / $1,398 |
| 14.2 to 16.5 | 678 | $659 / $902 / $1,215 |
| 16.5 to 19.7 | 678 | $604 / $827 / $1,167 |
| 19.7 to 65.2 | 680 | $485 / $664 / $896 |
That staircase is not five different roofing markets. It is one roughly fixed declaration divided by more and more area, and our band happens to cross it in the middle. A test that any per-square figure between about $660 and $1,320 would have passed at some row of that table is not a test.
One more table settles it, because it isolates the denominator entirely. Split the same filings by the assessor's storey count — the field our footprint proxy divides by — and nothing about the roofing changes:
| Assessor storey count | Rows | Median footprint proxy | Median declared | Median $/square |
|---|---|---|---|---|
| One storey | 2,149 | 1,334 sq ft | $13,000 | $777 |
| Two storeys | 1,016 | 1,040 sq ft | $15,550 | $1,216 |
| Three storeys | 211 | 1,037 sq ft | $20,000 | $1,513 |
Cost per square nearly doubles from one storey to three. Our band cannot be both right at $777 and right at $1,513, and neither figure describes a different kind of roof — they describe a different divisor. A single assessor field, one we have no way to audit, moves the answer further than every roofing decision in the calculator put together.
For completeness, the trend by year under the low-slope assumption runs $978 in 2023, $894 in 2024, $833 in 2025 and $956 in the part of 2026 we can see. We report it and draw nothing from it.
5. Verdict
Verdict
(C) Comparison rejected — the missing denominator was never the real problem.
The join did exactly what it was supposed to. An exact block-and-lot key, 12,667 of 12,778 filings matched to a parcel, and 3,392 single-family re-roofs left standing with a declared cost and a roof area. The sentence that killed our first San Francisco record — that the file states no roof size — is retired.
What replaces it is worse for the file. Declared cost scales as roof area to the power 0.275, explains 3.2% of the spread, and is an exact multiple of $1,000 more than half the time. Cost per square falls from $1,320 to $664 across the size range and rises from $777 to $1,513 across the assessor's storey field. Every one of those movements is larger than the difference between our band and any plausible rival. Nothing is banked and no number moved: our band stands as it did at the 2026-07 stamp on our roofing data, which predates the 2026-08-11 retrieval.
The earlier record stays in print unedited, and the pair is more useful than either page alone. We gave a shallow reason for rejecting a file, someone could have accused us of not trying hard enough, and the deeper reason turned out to be worse. A denominator is not what makes a permit file usable. A numerator that moves when the job changes is.
6. If you are collecting roofing quotes in San Francisco
Do not price your roof off your neighbours' permits, even though the file is public, searchable and looks authoritative. More than half the declared figures on it are round thousands, the commonest description is a canned sentence, and the number a contractor writes on an over-the-counter form is a fee input rather than a quote. If you want a comparison, ask a bidder for the square count and the pitch he is assuming and compare those, because they are the parts of a roofing price that anyone can check.
Second, know that your own roof is not your floor area. San Francisco houses are commonly built over a garage that the assessor may or may not count as a storey, and that one classification moves an area-based estimate by a factor of two or three. If you are using our calculator, measure or pace the footprint of the house rather than reading the square footage off a listing, because a listing quotes finished living area on every floor.
Third, get more than one bid, for the reason this record demonstrates from the other side: on a file of 3,392 comparable jobs the middle half of the declared prices spans two to one at every roof size we looked at. Whatever the honest price of your roof is, one quote will not find it. Our roof quote checklist covers what to ask, and the asphalt versus metal comparison covers the choice that moves the number most.
Frequently asked questions
Why can't you just divide the permit's declared cost by the roof area?
You can, and this record does it 3,392 times. What comes back is not a price per square, it is a division. Cost per square falls from $1,320 in the smallest fifth of the sample to $664 in the largest, and the declared cost barely moves with the roof at all — the log-log elasticity is 0.275 and the rank correlation 0.14. When the numerator does not respond to the denominator, the quotient tells you about the denominator's distribution and nothing else.
What is wrong with San Francisco's declared costs?
They look invented. 56.1% of them are exact multiples of $1,000, and the five commonest values in the whole cohort are $10,000, $12,000, $15,000, $8,000 and $9,000. The permit is an over-the-counter alteration filing whose fee scales with the declared amount, and the description is boilerplate: the commonest text, on 7,517 of the 21,400 filings we pulled, is one canned sentence, and a further 6,059 read simply “reroofing”. Compare Boston, where only 19.1% of roofing valuations are round thousands.
Does this change the earlier San Francisco record?
No, and it deliberately does not edit it. That record, retrieved 2026-08-05, rejected the file because 94% of filings state no roof size. This one supplies the size from the assessor and rejects it again for a different reason. Both stay in print, because the useful thing about the pair is that the first reason turned out to be the shallower one — we blamed the missing denominator, and the numerator was no better.
Could a different pitch assumption rescue it?
It moves the answer more than the data does, which is the objection. Assume every roof is flat and the median comes to $955 per square; assume medium slope and it comes to $812. That range spans the whole distance between our published typical and our high, and nothing in the file says which assumption is right. A comparison whose result we get to choose after seeing the data is not a check.