The roof area we manufacture, against 309 roofers who wrote theirs down
Published 2026-08-11 · records retrieved 2026-08-11 · our band fixed as of 2026-07 · how we build these numbers
Run your own numbers in the roof replacement calculator →
Our roofing calculator never asks how big your roof is. It asks for the footprint, the pitch and the depth of the eaves, and then it manufactures the roof area: expand the footprint by the overhang on all four sides, treat it as a rectangle at a 1.5:1 aspect ratio, multiply by a slope factor. Every dollar the calculator prints is that manufactured area times a per-square band. We published the chain, we published the parameters, and until now nothing outside this site had ever been laid against it.
Boston can lay something against it. Its roofers write the square count into the permit — not always, but 309 times in the cohort below — and its assessor publishes the floor area, storey count, roof structure and roof cover of every single-family parcel, keyed by the same parcel identifier the permit carries. Join the two and you get, for the first time, our arithmetic and a roofer's arithmetic describing the same house.
The short version: where the footprint is observed rather than guessed, our chain lands at 1.061 times the roofer's own count — within six per cent. Where the footprint has to be guessed, it collapses, and the collapse is systematic. And the dollar band, the thing this site actually sells, could not be checked here at all. All three of those are below.
1. What this record is
Two datasets, joined, both from the City of Boston open-data portal, both under the Open Data Commons Public Domain Dedication and License. The numerator is Approved Building Permits, CKAN resource 6ddcd912, restricted to the ROOF work type: 24,738 filings from 2009-12-11 to 2026-08-06, each with a declared valuation, a fee, and a free-text scope note. The denominator is the FY2026 Property Assessment, resource ee73430d, from the Assessing Department: LIVING_AREA, RES_FLOOR, ROOF_STRUCTURE, ROOF_COVER, BLDG_TYPE, land use. Both retrieved 2026-08-11.
The licence is the same on both sides and it is the clean one. The assessment file was last refreshed 2026-05-22 and will still say so. The permit resource is re-published daily — it moved twice while this record was being written — so the timestamp in the output below is ours at pull time and yours will be later. That is why every count on this page is pinned by an issued-date ceiling rather than by the day you run it.
# licence and freshness, straight from the portal metadata
for pkg in approved-building-permits property-assessment; do
  curl -s "https://data.boston.gov/api/3/action/package_show?id=$pkg" \
  | python3 -c "import sys,json; d=json.load(sys.stdin)['result']; \
      print(d['license_title']); \
      print([r['id'][:8]+' '+str(r.get('last_modified')) \
             for r in d['resources'] if r.get('datastore_active')][:1])"
done
# => Open Data Commons Public Domain Dedication and License (PDDL)
#    ['6ddcd912 2026-08-10T20:39:16.099856']   <- daily; yours will be later
#    Open Data Commons Public Domain Dedication and License (PDDL)
#    ['ee73430d 2026-05-22T15:39:06.823803']
Both pulls name their columns. The permit file also carries the applicant's name, the street address and two sets of coordinates; none of those columns is selected, none is on our disk, and none appears anywhere on this site. The scope note is selected, because the square count lives in it, and it is used for filtering and counting only — no filing is quoted at row level.
# the numerator. 10,000 rows a page against the CKAN datastore.
Q="SELECT permitnumber, comments, declared_valuation, total_fees, issued_date,
          status, occupancytype, sq_feet, parcel_id
   FROM \"6ddcd912-32a0-43df-9908-63574f8c7e77\"
   WHERE worktype = 'ROOF' ORDER BY permitnumber LIMIT 10000 OFFSET 0"
curl -s -G 'https://data.boston.gov/api/3/action/datastore_search_sql' \
     --data-urlencode "sql=$Q"

# the denominator. Owner name and mailing address are deliberately not selected.
Q="SELECT \"PID\", \"LU\", \"BLDG_TYPE\", \"NUM_BLDGS\", \"RES_FLOOR\", \"LAND_SF\",
          \"GROSS_AREA\", \"LIVING_AREA\", \"YR_BUILT\", \"ROOF_STRUCTURE\",
          \"ROOF_COVER\"
   FROM \"ee73430d-96c0-423e-ad21-c4cfb54c8961\"
   WHERE \"LU\" = 'R1' ORDER BY \"PID\" LIMIT 20000 OFFSET 0"
curl -s -G 'https://data.boston.gov/api/3/action/datastore_search_sql' \
     --data-urlencode "sql=$Q"
# => 24,738 roof permits; 30,441 single-family parcels
2. What it measures — and what it quietly does not
The square count is the roofer's, not the city's. Boston has a sq_feet column on the permit and it is zero on every one of the 1,152 filings in our cohort. What we are reading instead is prose: a scope note that says the job was a strip and re-roof and, in a quarter of cases, how many squares of shingle it took. We take the number only when the note contains exactly one such figure between 3 and 100. A roofer's square count is what he ordered, which may include waste, starter and ridge; it is not a surveyed area, and where it differs from one it will differ upward.
The floor-area proxy is ours, and it is the part on trial. The assessor does not publish a footprint. To get one we divide living area by the storey count — a choice, not a measurement, and the single most consequential line of code on this page. Section 4 measures what it costs.
A declared valuation is not a contract price, and the fee pulls on it. Boston's roofing fee tracks the declared amount at a median of $11.89 per $1,000 across this cohort, which is a standing invitation to declare low. What argues the other way here is the shape of the numbers: only 19.1% of these valuations are exact multiples of $1,000. Round numbers are what an invented figure looks like; $11,314 and $15,435 are what a copied contract price looks like. We cannot measure the understatement, only note that this file shows less of the tell than others we have opened.
Numerator and denominator age differently. The permit file moves daily and runs to 2026-08-06; the assessment file is a fiscal-year snapshot refreshed in May. A house re-roofed and then extended will be measured against its pre-extension floor area. Boston is also one city, with a housing stock heavy in colonials and capes and almost nothing built after 1990 in the single-family class.
This is not a check of the dollar band, and section 4 explains why not. Anyone leaving this page believing our roofing prices were verified against Boston permits has taken more than happened.
3. The cohort, the join, and where 24,738 becomes 1,152
The join key is exact, which is the one thing that goes right. Boston's permit carries a numeric parcel_id; the assessment file carries a ten-character zero-padded PID; left-padding the first gives the second. No fuzzy address matching, no truncation, no unit ambiguity. Everything that follows is lost to filters, not to the key:
| Step | Rows left | What went, and why |
|---|---|---|
Permits with work type ROOF | 24,738 | Issued 2009-12-11 to 2026-08-06; no duplicate permit numbers |
| Issued 2023-01-01 to 2026-08-01 | 5,362 | Our band is 2026 pricing; older filings measure inflation |
| Declared valuation above zero | 5,352 | 10 filings declare nothing |
| Parcel id found in the assessment file | 5,333 | 19 point at no parcel at all |
That parcel is R1 single-family | 1,856 | The largest single loss, 3,477 filings: 1,040 landed on two-family parcels, 924 on condominium mains, 649 on three-family, 130 on 4-to-6-unit apartments, 113 on mixed residential-commercial, 83 on larger apartments, and 538 spread across smaller classes |
| Scope note carries a strip / tear-off / replacement verb | 1,504 | 352 describe something else |
| Scope note free of repair, partial and other-trade words | 1,354 | Patches, sections, gutters, siding, skylights, porch and garage roofs |
| Assessor's roof cover is asphalt shingle | 1,249 | Slate, rubber and composition dropped — different bands, or none |
| Roof structure is flat, gable, hip or shed | 1,153 | 54 gambrel and 42 mansard: two pitches on one plane, and we have no factor for that |
| Footprint proxy between 400 and 6,000 sq ft | 1,152 | One impossible row |
| … of which the scope note states exactly one square count | 309 | The only rows where our arithmetic can be checked against anyone else's |
Read the fifth row again, because it is where the survivors acquire their bias. Boston is a two- and three-decker city; restricting to single-family parcels throws away more than two thirds of the joined filings and leaves a cohort skewed towards Hyde Park, West Roxbury and Roslindale rather than the dense inner neighbourhoods. That is the right cohort for our calculator, which prices a single-family roof, and it is not a cross-section of Boston.
The 309 that state a square count are a second selection on top of that, and not a random one: a roofer who writes “strip and re-roof, 18 square” is being more specific than one who writes “strip and re-roof”. We cannot test what that specificity correlates with. What we can report is that the two groups declare almost the same money: a median of $12,339 on the 309 that state a count and $12,500 on the 843 that do not. The square-stating group is not the expensive end of the file, which is the one obvious way this selection could have gone wrong.
# the join, the footprint proxy, and the square-count parser. All three
# are choices, so all three are printed.
key = lambda pid: str(pid or '').strip().zfill(10)      # 103662000 -> '0103662000'

AR, EAVE = 1.5, 1.25          # roofing.json: aspectRatio, overhang standard eaves ft
PITCH = {'F - Flat': 1.02, 'G - Gable': 1.20,           # roofing.json pitchMultipliers
         'H - Hip': 1.20, 'S - Shed': 1.20}

def derived_squares(a):
    fp   = float(a['LIVING_AREA']) / float(a['RES_FLOOR'])   # <-- the proxy on trial
    w, d = math.sqrt(fp * AR), math.sqrt(fp / AR)
    plan = (w + 2 * EAVE) * (d + 2 * EAVE)                   # overhang, four sides
    return plan * PITCH[a['ROOF_STRUCTURE']] / 100.0

SQ = re.compile(r'\b(\d{1,3}(?:\.\d)?)\s*(?:squares?|sqs|sq)\b(?!\s*(?:ft|feet|\.?\s*f))',
                re.I)
def stated_squares(r):
    hits = SQ.findall(r['comments'] or '')
    if len(hits) != 1: return None          # two numbers, no way to know which roof
    v = float(hits[0])
    return v if 3 <= v <= 100 else None
# => 1,152 rows with a derived denominator, 309 of them with both
4. Our geometry and Boston's roofers on the same axis
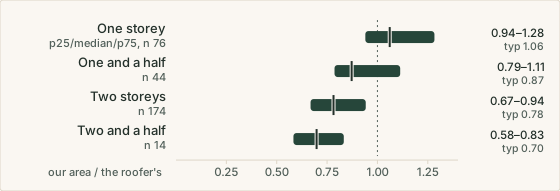
Across all 309 filings our derived roof comes to 0.858 of the roofer's stated roof at the median. That single number is useless, and printing it alone would have been the mistake this section exists to avoid, because it mixes two of our decisions together: the geometry (overhang, aspect ratio, slope factor) and the footprint proxy (living area over storeys). Split the sample by the assessor's storey count and they come apart:
| Assessor storey count | Rows | Our roof ÷ the roofer's, p25 / median / p75 |
|---|---|---|
| One storey | 76 | 0.940 / 1.061 / 1.283 |
| One and a half | 44 | 0.787 / 0.872 / 1.113 |
| Two storeys | 174 | 0.668 / 0.782 / 0.942 |
| Two and a half | 14 | 0.583 / 0.698 / 0.833 |
The slide is monotone and it has an obvious mechanism. On a one-storey house the assessor's living area is the footprint and no division happens — the proxy is not a proxy. On everything taller we divide, and the divisor is wrong in a predictable direction: upper floors are smaller than ground floors, and single-storey ells, porches and attached garages carry roof while carrying little finished floor area. Dividing by two hands a two-storey colonial a footprint that is too small, and the error compounds with height.
So the honest cohort is the 76 one-storey filings — ranches, capes, raised ranches, bungalows — where nothing but our geometry stands between the assessor's number and the roofer's. There our chain returns 1.061, and the middle half of the sample runs 0.940 to 1.283. The six per cent is not the interesting number — the spread around it is far too wide for a median to be trusted to a decimal place. The interesting part is that a chain we wrote from takeoff convention, with no outside evidence behind it, lands on its first outside test slightly above a professional's own count rather than somewhere else entirely.
Run the same 76 filings backwards and ask what slope factor would have made our chain exact, holding the overhang fixed. The answer is a median of 1.131, with the middle half between 0.935 and 1.277. Our low-slope option is 1.08 and our medium-slope option is 1.20; the implied number falls between them, which is where a mixed sample of gable and hip roofs on modest Boston houses ought to fall. It is not evidence that either option is right. It is evidence that neither is absurd, which is more than we had.
The dollar band, and why it is not tested here
Our asphalt architectural band is $450 / $575 / $750 per square installed, plus tear-off at $100 / $160 / $250, so a full strip-and-replace is $550 / $735 / $1,000. Massachusetts carries a roofer-wage index of 1.31 in our data; applied to the roughly 65% labour share that is a multiplier of 1.2015, putting the band at $661 / $883 / $1,202. Against that, declared valuation over stated squares runs $566 / $807 / $1,230 on the 309, and over derived squares $663 / $921 / $1,296 on all 1,152.
Those medians sit close to ours and we are not going to bank it, because the file does not price roofs the way our band does. Sort the 309 by how big the roof was:
| Stated squares | Rows | Declared value per square, p25 / median / p75 |
|---|---|---|
| 4 to 11 | 61 | $701 / $1,088 / $1,536 |
| 11 to 14 | 61 | $621 / $892 / $1,279 |
| 14 to 16 | 61 | $525 / $727 / $1,082 |
| 16 to 20 | 61 | $570 / $743 / $1,226 |
| 20 to 80 | 65 | $475 / $667 / $1,007 |
A twenty-four-square roof is billed at two thirds the rate of a ten-square roof. Least squares on the same 309 gives value = $10,554 + $244 × squares, and the log-log elasticity of value with respect to squares is 0.588 rather than 1. That is a job with a large fixed component — crew, dumpster, staging, permit, the day itself — and a modest marginal rate on top. Our band has no fixed component at all. Asking it to match a median cost per square is asking it to reproduce a ratio whose value depends on how big the houses in the sample happen to be.
We have met this before. Our sewer record found $4,813 + $128 per foot in this same shape and rejected the per-foot comparison for it. Two trades, two cities, the same finding: a per-unit band is not what a declared permit valuation is measuring. That is a real criticism of how we model roofing, and one city cannot tell us what national fixed cost to add, so nothing moves today on the strength of it.
5. Verdict
Verdict
(A) Geometry confirmed — on 76 houses, and only the half of the arithmetic that has no money in it.
Three things failed or went unchecked, and they come first. The dollar band was not tested: declared cost scales as squares to the power 0.588 in this file, so a per-square comparison would be checking arithmetic these filings do not perform, and the closeness of the medians is a coincidence of sample size rather than a result. Our footprint proxy failed, from 1.061 at one storey down to 0.698 at two and a half — anyone repeating this join elsewhere should expect the same bias. And the cohort that carries the positive finding is 76 filings in one city, self-selected by roofers who chose to write a number down.
What passed is worth having anyway. On the only rows where the footprint is observed rather than guessed, the overhang-and-slope chain in roofing.json — a 1.25 ft eave on a 1.5:1 rectangle, times a slope factor — reproduces a professional roofer's own square count to within six per cent at the median, and the slope factor those roofers imply, 1.131, sits between our low and medium options rather than outside both. That chain has been printed on this site since launch with nothing behind it but standard takeoff practice. It now has 76 outside observations behind it.
Nothing moved. The parameters above stand as they did at the 2026-07 stamp on our roofing data, which predates the 2026-08-11 retrieval. The correction this record forces is not numeric: roofing.json described its overhang and pitch factors as geometry taken from standard practice, never checked. That sentence was true and is no longer, and it is amended in place rather than written back over what you just read.
6. If you are collecting roofing quotes
The transferable finding is the fixed cost. On this evidence a small roof does not get a small price, it gets a bad rate: ten squares billed at $1,088 apiece against $667 for twenty-four. If your roof is at the small end, expect the per-square figure in any quote — ours included — to run well above the headline, and ask the bidder to separate mobilisation, disposal and permit from the per-square work so you can see which part is not shrinking. If your roof is large, the same arithmetic runs your way, and a bidder still quoting a flat rate per square is leaving that in his own pocket.
Second, count your own squares before anyone counts them for you, and know which number you are being handed. A roofer's square count is material ordered, not surface measured, and the difference is the waste allowance — ours is 10%. Ask whether the bid's square count includes it. Ask what pitch was assumed: between our low-slope and steep factors there is a 31% difference in area on the same footprint, which is a third of the job.
Third, if you are in a city that publishes both a permit file and an assessor file, do not do what we did without checking it. Floor area divided by storeys is not a footprint on any house taller than one storey, and it fails in the direction that flatters a per-square rate. Our roof cost factors guide covers what actually moves a roofing number, and the quote checklist covers what to ask before signing.
Frequently asked questions
Can I find out how many squares my roof is from public records?
Not directly, and that is the whole problem this record is about. No assessor publishes roof area. What Boston publishes is a floor area, a storey count and a roof shape per parcel, and separately a permit file in which roofers sometimes write the square count into a free-text scope note. On 309 filings the two can be put side by side. Everywhere else the roof area has to be manufactured from the floor area, and this record measures how badly that goes: on one-storey houses the manufactured figure runs 1.061 times the roofer's own count, on two-storey houses 0.782, on two-and-a-half-storey houses 0.698.
Does dividing floor area by storey count give you the footprint?
On a one-storey house, trivially yes, and there our arithmetic checks out. On anything taller it understates, and the error grows with height: the ratio of our derived roof to the roofer's stated roof slides from 1.061 at one storey to 0.782 at two and 0.698 at two and a half. Upper floors are smaller than the ground floor, and single-storey ells, porches and attached garages carry roof without carrying much finished floor area. Anyone joining a permit file to an assessor file to manufacture a denominator should assume the same bias and say so.
Did this move the roofing calculator's prices?
No, and it could not have. The dollar side of this file cannot check a per-square band, because declared cost is not proportional to squares in it: least squares gives $10,554 plus $244 per stated square, and the log-log elasticity is 0.588 rather than 1. Median cost per square falls from $1,088 on ten-square roofs to $667 on twenty-four-square roofs. That is the shape of a job with a large fixed component, which our band does not model, so a per-square comparison would be checking arithmetic the filings do not perform.
Why throw away gambrel and mansard roofs?
Because we have no honest multiplier for them. Our data carries four slope factors — flat, low, medium and steep — all of them the geometric factor for a single constant pitch. A gambrel or a mansard has two pitches on the same plane, the lower one very steep, and none of our four numbers describes that. Ninety-six filings landed on those two shapes and we dropped them rather than pick a factor that would have been invented on the spot.